Common Input Data
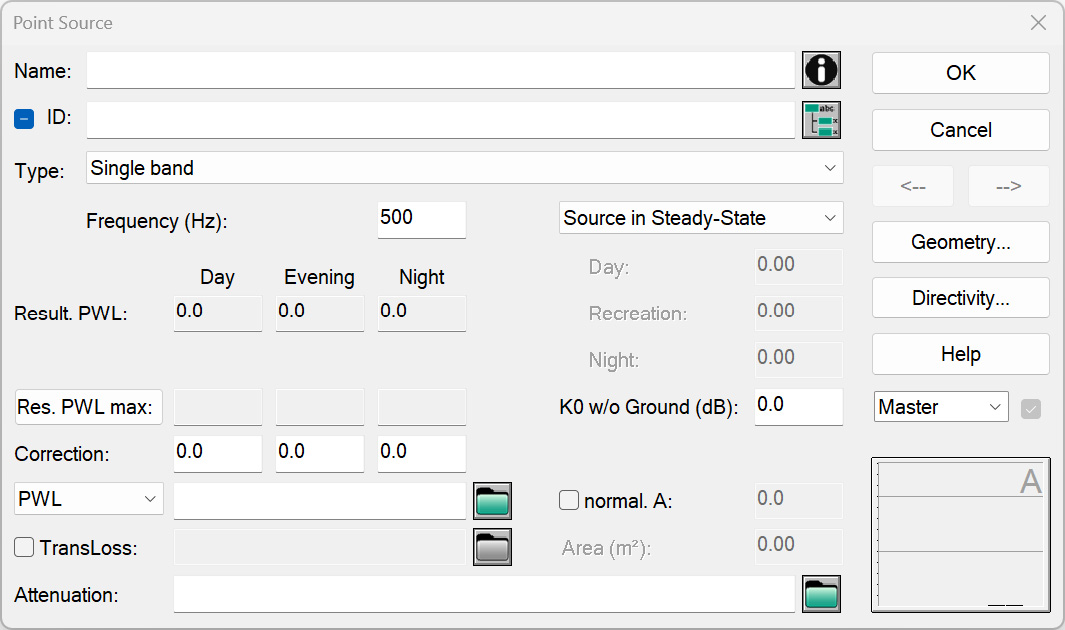
Name, Memo-Window, ID, ObjectTree, Master
see Dialog Options Name, ID, INFO, ObjectTree, Master in the manual "Introduction to CadnaA"
Result PWL
On the dialogs Point Source, Line Source, Area Source and vertical Area Source the following values and settings govern the resulting sound power level „Result PWL“:
- Type (Single Band, Spectrum or SET-S module, see below)
- Frequency (Hz)
- Correction D/E/N (dB)
- Res. PWL (dBA), PWL‘ (dBA), PWL“ (dBA) and Res. PWL max (dBA), PWL‘ max (dBA), PWL“ max (dBA)
- type of emission D/E/N:
- PWL (dBA): at point, line, area sources and
- PWL’ (dBA): at line sources
- PWL’’ (dBA): at area sources
- PWL-Pt (dBA): moving point source at line and area sources
- TransLoss/Attenuation (dB)
- Area (m²)
- normalized A (dBA)
as well as the input or settings for operating time („Source in Steady-State“, „Operating Time (min)“). The resulting sound power level is calculated from these parameters and displayed for the time periods Day/Evening/Night („Result PWL“).
Maximum Level Lmax
For point, line and area sources, a correction „Delta“ applied to the emission level [Res. PWL/PWL‘/PWL‘‘] (depending on the selection) can be entered via the „Res. PWL/PWL‘/PWL‘‘ max“ button.
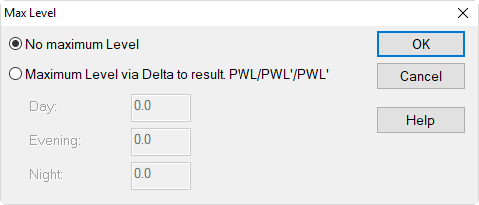
This correction is added to the PWL-type selected for the source (see above) and the sum is displayed after closing the Max Level dialog in the boxes „Res. PWL/PWL‘/PWL‘‘ max“ of the source for D/E/N.
The following cases have to be distinguished:
- specifying the maximum emission level Lmax based on PWL, PWL’, or PWL’’: The source radiates as a whole, in special at line and area sources. This means that the resulting level Lmax differs from the level Leq just by the Delta values D/E/N.
- specifying the maximum emission level Lmax based on PWL-Pt of a moving point source:
- at line sources: Upon calculation, the point source is moved along the line source in steps and the maximum value evaluated.
- at area sources: Upon calculation, a grid of point sources is spread within the borders of the area source and the maximum value evaluated.
To calculate the maximum receiving level select at least one of the evaluation parameters LmaxD/E/N (see Evaluation Parameters Tab).
Note
If emission is specified spectral (1/1 or 1/3 octaves), the maximum level Ld/e/n is not calculated.
Type
From the list box „Type“ the following options can be selected:
- Single band,
- Spectrum or
- a pre-defined SET-S module (see SET-S).
The options „Single band“ and „Spectrum“ require the input of acoustical data determining the resulting sound power level. In contrary, the selection of an SET-S module prompts to specify the physical parameters of the respective type of source in a sub-table (e.g. flow rate in m³/s, nominal capacity in kW). From these parameters the sound power level spectrum is calculated.
Toggling the Type per Attribute
By using the attribute FREQ the dominant frequency can be changed. Use the space key or a blank to toggle to type „Spectrum“.
Single band / Frequency (Hz)
With selection „Single band“ the sound power level entered under PWL, PWL’, PWL’’, or PWL-Pt is considered as the A-weighted total level. In this case, for frequency dependent propagation parameters (e.g. air absorption) the resulting values is calculated for the frequency specified. Default frequency value is 500 Hz (see ISO 9613-2, ISO-9613-2-2024).
Spectrum
With selection „Spectrum“ the sound power level entered under PWL, PWL’, PWL’’, or PWL-Pt is considered as A-weighted level per octave or third-ocatve band. In the first case, the displayed sound power level PWL („Result. PWL“ in dB(A)) results from adding 10lg9=9,5 dB for 9 octaves, in the latter case by adding 10lg27=14,3 dB for 27 third-octaves (holds for „Res. PWLmax“ as well)
Alternatively - and this is the common procedure in conjunction with using spectra - instead of a figure an ID of the respective spectrum is entered or selected.
Example for „Spectrum“
- Enter via Tables| Libraries (local)|Sound Levels the following sound power spectra:

- On the point source’s dialog select for „Type“ the option „Spectrum“ for spectral calculation.
- Enter the ID „SP_001“ of compressor 1 into the box PWL. This refers to that spectrum.
- The text sequence SP_001 may either be entered via the keyboard or be selected from the local library by clicking the file selector symbol, subsequently selecting the first data set and clicking OK.
Note
Access to the global libraries occurs by clicking the file selector symbol while holding the SHIFT-key pressed. Upon selection of a spectrum from the global library the data set is copied automatically to the local library.
In this example, after having selected the compressor spectrum the resulting A-weighted sound power level (Result. PWL) and the spectrum shape are displayed, the latter in the lower right corner of the dialog Point Source.
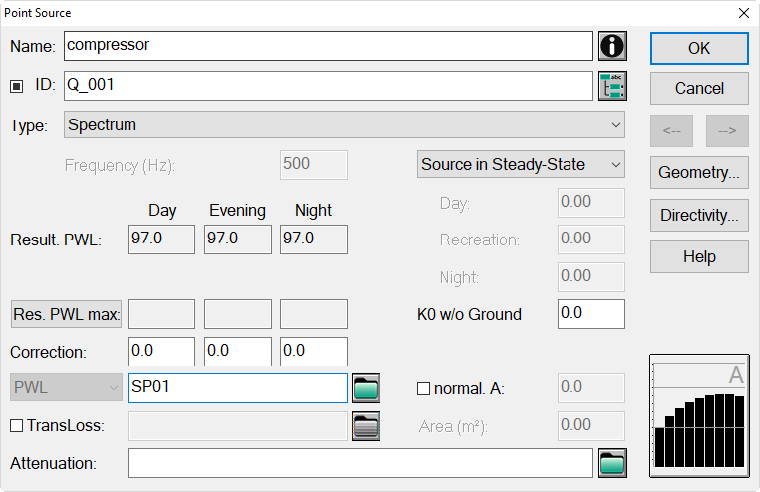
Dialog Point Source with referencing to octave spectrum-ID SP_001
- Now, upon clicking again to the file selector symbol and selecting a different spectrum, the former reference will be replaced by the new one.
In case a second spectrum should be added energetically to the first one, considering the rules of level summation, press the CTRL-key prior to selection of the second spectrum. This causes the second spectrum to be entered with the operator ++ in front being the symbol for energetic level summation (for further operators see the CadnaA-manual „Attributes, Variables, and Keywords“, Chapter 5 - Operators & Functions).
This summation formula can also be entered via the keyboard. During typing the red text indicates that the formula is not complete or cannot be evaluated, respectively.
local SET-S modules
The SET-S modules from the local SET-S library are listed here. Upon selection of a module and input of the respective parameters a..j on the sub-table the resulting spectrum and the A-weighted total level „Result. PWL“ is displayed.

Example: SET-S module „Radial Roof Ventilator“ selected
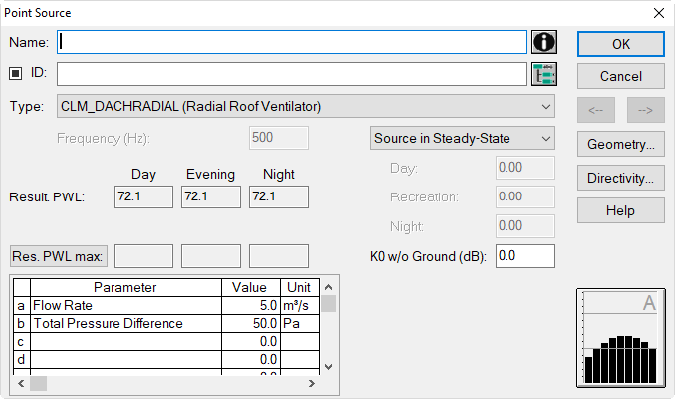
Sound power of roof ventilator after specifying its parameters
A total overview of all SET-S modules delivered with CadnaA see SET-S.
Attributes
Via the attributes SET_ID and SET_PARM_A to _J an SET-S module can be selected and its parameters be defined (see Table Object Attributes in the CadnaA manual „Attributes, Variables, and Keywords“.
Spectrum Monitor
 |
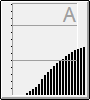 |
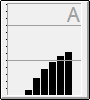
The spectrum monitor at the bottom right corner of the source dialog displays the frequency spectrum in from of bars. Clicking the diagram cycles among no weighting (i.e. linear) and A-, B-, C- or D-weighting. With this switching the emission of the source remains.
Additional Information
PWL-Type
The input box for the emission may contain a single number, a reference to a spectrum, or a combination of both, or even an equation, e.g. L01+5, 100+10*log10(20) or L01++L02.
Also, expressions based on the so-called „Reverse Polish Notation“ (RPN) can be entered. These must expressions begin with „RPN:“, for example: „RPN: 100 100 ++ 1 +“ gives 104.
Result. PWL
When the sound power level per unit length PWL, is entered for a line source or the sound power level per unit area PWL’’ is entered for an area source, the total sound power level resulting from the dimensions of that source is displayed here (excluding the correction for operating time and the directivity index K0/DΩ). This sound power level is used as the emission characteristic of the source within the calculation of sound propagation.
As the height of the terrain at the polygon points of the source is not known when the values are entered, this total sound power level refers, with relative heights, to the horizontal projection of the source. Consequently, this will not be correct for inclined line or area sources. Upon calculation, however, the absolute heights at the polygon points is updated and the correct total sound power level is determined.
Inclined Sources
When entering the sound power level per unit length or unit area for inclined line or area sources, the heights of which are given as relative coordinates, the total value displayed for „Result PWL“ is not yet correct as the increased radiating area due to the inclination of the source is not considered so far. However, this will the case when the dialog is closed and reopened.
Example: inclined area source
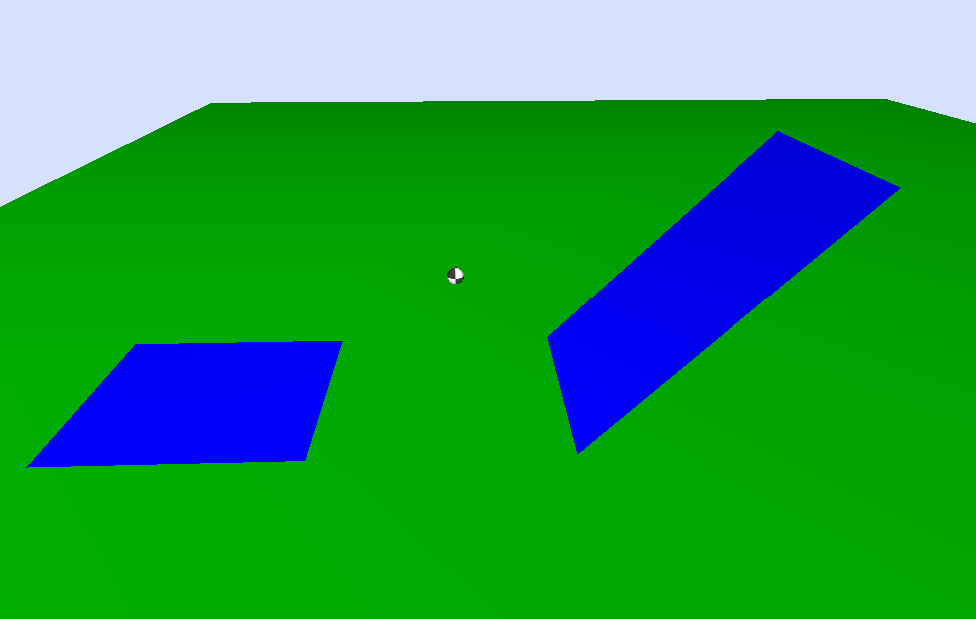
Plane area source and inclined area source (by 45 degrees), both having the same 2D-ground plane
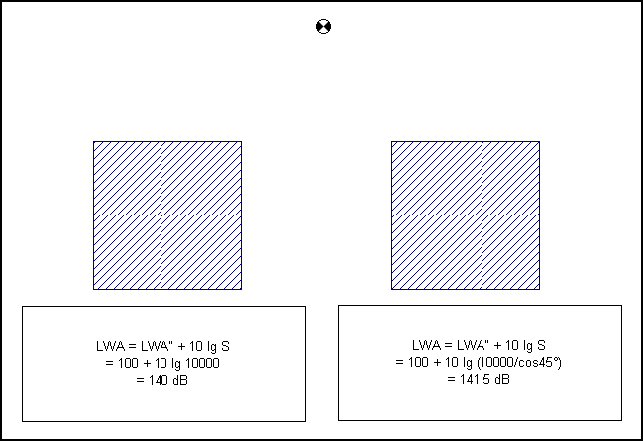
Resulting sound power level of a plane area source (left) and of a by 45° inclined area source (right), both having the same 2D-ground plane
Correction
To consider different emissions for the time periods Day, Evening, and Night specify a correction for each of these periods. The correction entered will be added to the sound power level.
Attenuation
Via the „Attenuation“ box a value can be entered which will be considered as an additional damping of the source’s emission. Furthermore, attenuation spectra from the local and global libraries can be referenced. The entered or referenced attenuation will be subtracted from the sound power level.
Example
After the compressor (with PWL=104 dB(A)) of the recent example a silencer with an additional attenuation of 8 dB is installed.
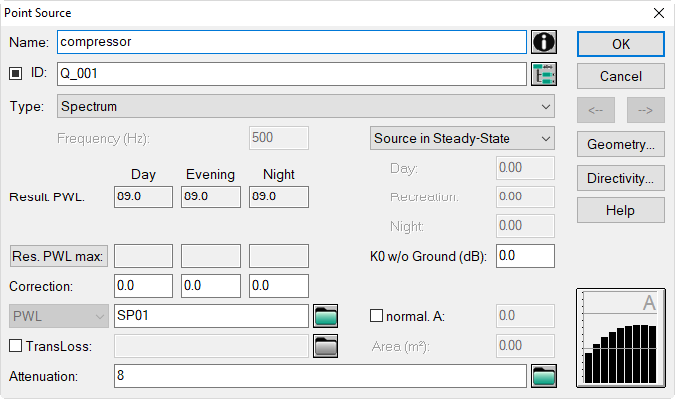
Dialog Point Source with an attenuation of 8 dB
- Enter in box „Attenuation“ the figure 8, resulting in a sound power level („Result. PWL“) of 96 dB(A).
Using Equations
Note
The attenuation input box may also receive complex formulas or the ID of a spectrum. Formulas for „Attenuation“ are restricted to 63 characters.
Note
While the „Attenuation“ value is directly subtracted from the PWL, the resulting PWL when specifying „TransLoss“ - in conjunction with the interior sound pressure level („interior level“) - considers also an area and a diffuse-to-free-field correction (see below).
For example, several attenuations may attenuate the sound power radiated (e.g. pipe elbows, changes in cross section, fittings, and silencers). This sum of attenuations may be described by, e.g.: 8+4+3.5+2.
Of course, the total attenuation could be entered by a single figure directly, but the specification as a sum illustrates more obviously the individual attenuations contributing and also will be listed in the respective column of the source table. The line offers to enter even more complex formulas, such as: ((8+4+3.5+2)++23)-19.
As described for other input boxes, ++ stands for the energy-equivalent (or level) addition, and -- for the level subtraction (see also CadnaA-manual „Attributes, Variables, and Keywords“, see Chapter 5 - Operators & Functions).
Referencing Attenuations
Furthermore, arbitrary damping spectra from the local or global library (see Chapter 11 - Libraries) can be referenced via the input box „Attenuation“.
In the subsequent figure, the attenuation spectra of two changes in cross section and a silencer are combined at a line source modeling a pipe section:
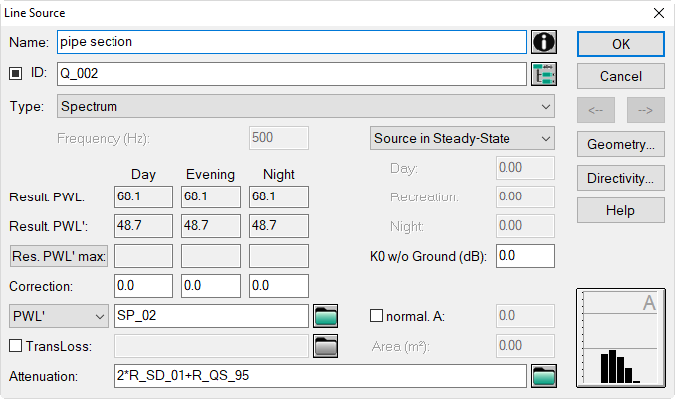
Combined attenuations on dialog Line Source
Sound Power of a moving Point Source PWL-Pt
The line or the horizontal area source may be used to model the emission of a moving point source (emission type option: PWL-Pt).
When using a line source, the sound power level of the point source, the number of events per hour Q (number of pass-bys) and the speed (in km/h) have to be specified. The resulting sound power level PWL and the sound power level per unit length PWL’ calculate from:
\(PWL=PWL_{Pt}+10lg\frac{Q}{(h^{-1})}+10lg\frac{l}{(m)}-10lg\frac{v}{(km/h)}-30dB\)
\(PWL'=PWL_{Pt}+10lg\frac{Q}{(h^{-1})}-10lg\frac{v}{(km/h)}-30dB\)
With area sources, the sound power level of the point source and the number of events Q are required. The resulting sound power level PWL and the sound power level per unit area PWL’’ calculate from:
\(PWL=PWL_{Pt}+10lg\frac{Q}{(h^{-1})}\)
\(PWL''=PWL_{Pt}+10lg\frac{Q}{(h^{-1})}-10lg\frac{S}{(m^2)}\)
Example
see manual „Introduction to CadnaA“, Internal Driveways and Areas
normalized A
With this check box „normal. A“ activated and a number entered, a constant K in dB is subtracted from or added to the frequency-band levels resulting from the specified PWL in order to obtain this value for the total A-weighted sound power level. This option enables the application of normalized spectra (with a total sum level of 0 dB) the final emission value of which is specified be entering the respective value in input box „norm. A“.
Transmission Loss
All types of general sources described above can be applied to model the sound radiation from buildings. In order to specify the radiated sound power based on the interior level SPL activate the option „TransLoss“. Subsequently, the emission type (Lw-type) switches to „Interior Level“.
Enter an interior level and in the box „TransLoss“ a single number rating (weighted sound reduction index Rw or STC) or the ID of a sound reduction index spectrum. All techniques for the selection of spectra from the libraries and the handling of user-defined formulas apply as before.
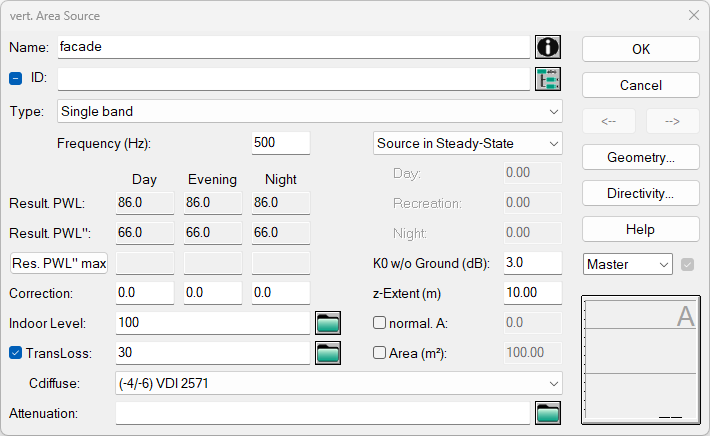
Dialog vertical Area Source (radiating area S=100 m²), Transmission Loss specified by a single number rating and Cdiffus according to VDI 2571
When entering Cdiffus, the diffusivity term can be selected. It is possible to keep the default setting according to VDI 2571 (-4 / -6) or alternatively select a diffusivity term according to EN ISO 12354, Annex B.
The resulting sound power level PWL calculates in CadnaA from (with \(S_0=1 m^2\)):
\(L_{wA}=L_{p,in} + C_d -R+10lg\frac{S}{S_0}\)
The calculation follows the VDI guideline 2571 (edition 8.1976 2571-76) or EN ISO 12354-4:2017
For the default option Cdiffus (-4 / -6) according to VDI 2571, the following applies:
-
If Type: Single band is selected, Cdiffus = -4.
-
If Type: Spectrum is selected, Cdiffus = -6.
Additional options for the diffusivity term Cdiffus, in accordance with EN ISO 12354-4:2017, Annex B, can be selected depending on the specific room situation.
| Situation | Cd (dB) |
| relatively small, uniformly shaped rooms (diffuse field), reflecting walls (REMARK: as applied by VDI) | -6 |
| relatively small, uniformly shaped rooms (diffuse field), absorbing walls | -3 |
| large flat or long halls, many sources (average industrial building), reflecting walls | -5 |
| industrial building, few dominating directional sources, reflecting walls | -3 |
| industrial building, few dominating directional sources, absorbing walls | 0 |
When the option „TransLoss“ is activated, a value has to be entered. With this box being empty no radiated sound power results.
Additionally, with point and area sources an area (m²) has to be entered in the respective box as this value is not available from the object’s geometry data.
Example for spectral Sound Reduction Index
- Select for the sound insulation of the facade in the previous example the spectrum „steel sheet with trapezoidal corrugations 45 mm“ from the global library (menu Tables|Libraries (global)|Sound Reduction (ID: R26).
- To this end, click on dialog vertical Area Source with the SHIFT-key pressed on the file selector symbol to the right of the input box „TransLoss“.
- Select the spectrum with ID „R26“ and click OK.
- Switch the emission type from „Single band“ to „Spectrum“.
The sound power level and its spectrum as resulting from the input data is displayed.
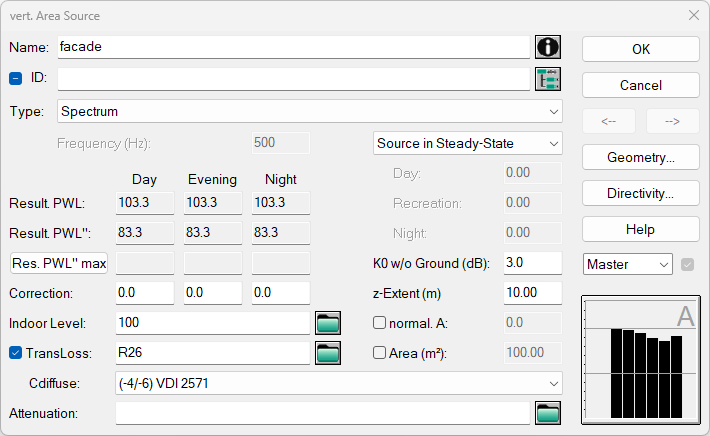
Dialog vertical Area Source (radiating area S=100 m²), Transmission Loss specified by referencing a sound reduction spectrum
Area (m²)
With point and line sources a radiating area has to specified when modelling sound radiation based on the indoor level. To this end, click the check box, and enter the relevant area.
With horizontal area sources a respective value is required just when the actual radiating area differs from the 2D geometrical area of the area source (see Geometry dialog).
At vertical area sources this option is not available. The radiating area results here from the source‘s height data (2D-area=0 m², see Geometry dialog).
For horizontal and vertical area sources, the difference between the sound power level PWL and the sound power level per unit area PWL’’ results - as before - from the entered geometry, since the entire source radiates (i.e. as drawn).
Example
The sound radiation from a glazed facade within a heavy outer wall is modelled by a vertical area source in front of the entire wall. In order to ignore the radiation from the heavy parts of the facade just the area of the actual glass facade is entered.
Note
Check for the value of „Result. PWL“. As long as it is zero, parameters are still missing, for instance, with calculations based on the indoor level either the area or the sound reduction index/transmission loss.
The 2D-length (m) of the line source and the 2D-area of the area source (m²) can be checked via the Geometry dialog. For vertical area source this value is zero as this area entered refers to the horizontal projection (2D-area).
The length of a line-like object can be specified exactly (see Set Length in the manual „Introduction to CadnaA“).
Source in Steady-State/Operating Time (min)
By default, the option „Source in Steady-State“ is selected where no correction for operating time applies. In this case, the specified noise emission is constant for each entire daily period (see Reference Time Tab).
By selecting the option „Operating Time (min)“, the source-specific operating time in minutes can be entered for each daily period „Day|Recreation (=Evening)|Night“. The correction for operating time result from the operating times and the reference time intervals D|E|N specified in the configuration of calculation (see Reference Time Tab) and calculates from:
\(10lg\frac{T_{\text{operating time}}}{T_{\text{reference time}}}(dB)\)
Addressing Diurnal Patterns
Furthermore, diurnal patterns (= hourly emission profile covering 24 hours) can be used for industrial sources in CadnaA. To this end, first define a diurnal pattern in the local or global library „Diurnal Patterns“ (see Diurnal Patterns). Subsequently, this diurnal pattern can be selected from the list box.
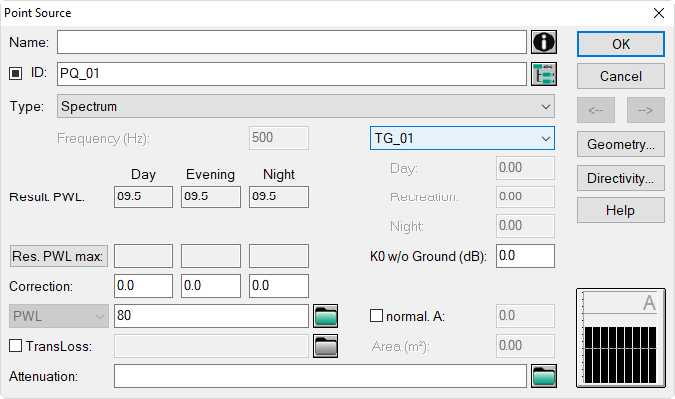
Point source with selected diurnal pattern TG_01
Diurnal patterns may also get assigned using the attribute TEINW_GANG (see Table Object Attributes in the manual „Attributes, Variables, and Keywords“).
Note
When using diurnal patterns describing the additional evaluation parameter „loudest hourly level per time period D/E/N“ (L1hMaxD, L1hMaxE, L1hMaxN) are available on tab „Evaluation Parameter“ (see Evaluation Parameters Tab).
Example 1
The receiver level of a point source without correction for operating time is 35 dB(A). Then, the following diurnal pattern TG_01 is selected:
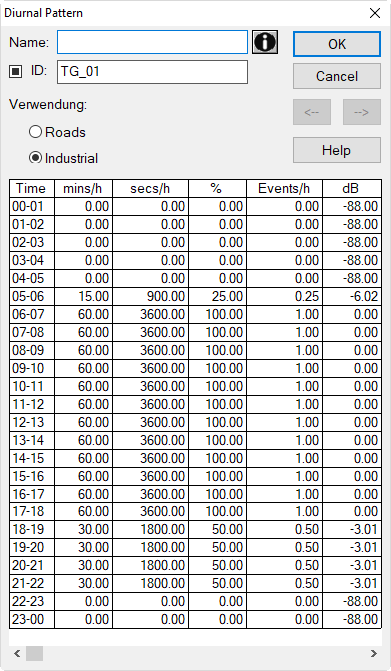
Diurnal pattern TG_01 for example 1
Considering the following allocation of hours to the time periods:
- Day (D): 6-18 h (= 12 hours)
- Evening (E): 18-22 h (= 4 hours)
- Night (N): 22-6 h (= 8 hours)
Example
Path: PS with diurnal pattern 1 - A & B.cna
causes the following results as listed in the subsequent table:
| Evaluation Parameter | Calculation | Remarks | File |
| Ld | $=35 dB(A)$ | source active permanently during D | A |
| Le | $=35+10lg\frac{(4*30)min}{4*60)min}=35-3=32.0 dB(A)$ | source for (4*30) min active during E | B |
| Ln | $=35+10lg\frac{15 min}{8*60)min}=35-15.1=19.9 dB(A)$ | source just 15 min active during N | A |
| L1hMaxD | $=35 dB(A)$ | because emission is constant during D | A |
| L1hMaxE | $=35+10lg\frac{30 min}{60 min}=35-3=32.0 dB(A)$ | source is active for 30 min during loudest hour | B |
| L1hMaxN | $=35+10lg\frac{15 min}{60 min}=35-6=29.0 dB(A)$ | source is active for 15 min during loudest hour | A |
Example 2
Again, the point source causing a receiver level of 35 dB(A) without correction for operating time is used. Then, the diurnal pattern TG_02 as shown on the following page is selected.
Considering the following reference times for the daily periods:
- Day (D): 7-20 h (= 13 hours)
- Evening (E): 6-7 h and 20-22 h (= 3 hours)
- Night (N): 22-6 h (= 8 hours)
Example
Path: PS with diurnal pattern 2.cna
causes the following results as listed in the subsequent table:
| Eval.Param. | Calculation | Remarks |
| Lde | $L_d=35dB(A)$ $L_e=35+10lg\frac{(3*10)min}{(3*60)min}=35-7.8=27.2 dB(A)$ $L_{de}=10lg[\frac{1}{16}(13*10^{0.1L_d}+3*10^{0.1(L_e+6)}]=34.7 dB(A)$ |
Ld: source is permanently active during D, Le: source is just active for (3*10) min during E, Lde: considers a penalty of 6 dB for recreation/evening period |
| Ln | $=35+10lg\frac{(4*30+4*15)min}{(8*60)min}=35-4.3=30.7dB(A)$ | source active for 180 min within 480 min |
| L1hMaxN | $=35+10lg\frac{30min}{60min}=35-3=32.0dB(A)$ | loudest hour occurring during N (last from 22-2 hours) |
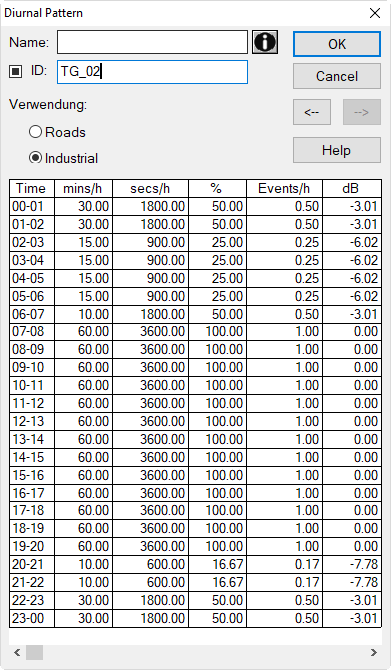
Diurnal pattern TG_02 for example 2
K0 without Ground
solid angle correction K0 (dB) accord. to VDI 2714 2714-88 or the directivity index DΩ accord. to ISO 9613 ISO-9613-2-2024
The excess level in the direction of sound radiation due to reflecting surfaces close to the source can be accounted for by a global correction, the solid angle correction K0 or the directivity index DΩ. Since the ground reflection is already accounted for within the calculation according to ISO 9613-2, just the remaining reflecting surfaces are to be considered when determining the value of K0 (thus called „K0 without Ground“, i.e. ignoring the ground).
The concept of the directivity index refers to omni-directional radiating point sources. In case of directional sound radiation (i.e. using a directivity pattern, see Directivity at Industrial Sources) it is recommended to set the directivity index DΩ to 0 dB, since otherwise the radiation - irrespective of the shape of the directivity pattern - would be generally increased by the entered directivity index.
In case of K0 or DΩ > 0 the reflection from the building itself (i.e. reflector near the source) must not be included as the excess level is already accounted for by the correction K0 resp. DΩ. In order to maintain the building’s reflective properties for all other sound sources the „Minimum Distance from Source to Reflecting Object“ specified via menu Calculation| Configuration, tab „Reflection“ (see Reflection Tab), has to be larger than the distance of the source in front of the facade (e.g. 0.5 m).
see Area-like Objects, Additional Information for object „Building“
Note
Starting with CadnaA release version 3.6 the horizontal distance (2D distance) is used to calculate the directivity index K0 or DΩ - instead of the 3D distance between source and receiver. This change causes level differences for very different heights of source/receiver only.
Examples for K0 / DΩ
| Source Location | K0 / DΩ without Ground (dB) |
| Source at any height above the ground(solid angle: 2π) | 0 |
| Source at any height above the ground in front of a wall (solid angle: π) | 3 |
| Source at any height above the ground in a corner(solid angle: π/2) | 6 |