Grid Appearance
Via the dialog Appearance on the Grid menu the settings for displaying grid results are defined. The dialog comprises of the following sections:
- section „Show“: selection of display mode
- section „Color Palettes“: selection of color palettes, globally for all evaluation parameters or individually for each evaluation parameter.
- Level Range and Line Width: This section corresponds with the options available in former releases of CadnaA. The display options resulting from former CadnaA files will be displayed for color palette „(file)“.
Note
When using color palettes, it is recommended to deactivate the option „Level Range“.
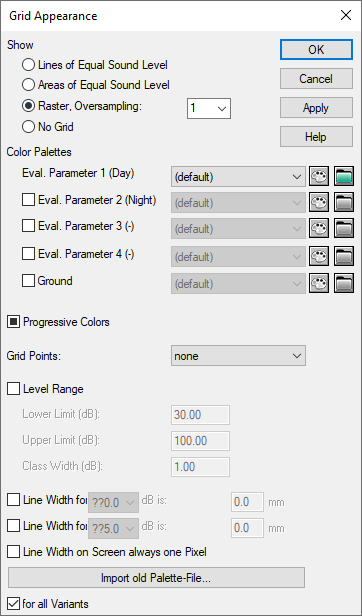
Dialog Grid Appearance
Button „Apply“
When clicking the button „Apply“ the modifications are applied to the main window immediately while keeping the dialog open.
Show ...
Lines of Equal Sound Level
With this option the lines of equal sound level are displayed on the grid. The value range and the class width (and all further settings) result from the select color palette/s. The grid legend results from the specification for „Single Value“ of the selected color palette (see Symbol Library).
Areas of Equal Sound Level
With this option the areas of equal sound level are displayed on the grid. The value range and the class width (and all further settings) result from the selected color palette/s. The grid legend results from the specification for „Interval“ of the selected color palette (see Symbol Library).
In either case, the boundaries are interpolated (by linear interpolation). With the option „Exclude Sound Sources/Buildings“ (see Grid Specification) activated, uncolored areas in the vicinity of buildings or area sources may result, depending on the spacing of receiver point. In order to avoid this, the option „Extrapolate Grid under Buildings“ on menu Calculation|Configuration is activated by default (see General Tab). In this case, the colored areas of the grid start from the object’s boundaries.
Raster, Oversampling
When the oversampling is set to 1 (default value) the representation applies the resolution of the specified receiver spacing (see Grid Specification). With an oversampling of larger than 1 intermediate grid points are generated additionally. The sound level at those intermediate points is determined by linear interpolation.
No Grid
With this option no noise map is displayed on the graphics (2D-view). Nevertheless, on the 3D-Special view the colored grid is still displayed. To avoid this, switch to the option „Ground“ from the list box on the toolbar of the main dialog. This will cause the no grid being displayed on the 3D-Special view.
Color Palettes
On the dialog section „Color Palettes“ the color palettes for up to four evaluation parameters and for the ground grid are selected. With the default setting, the color palette selected for evaluation parameter 1 is applied to all further evaluation parameters and the ground grid. To select a color palette for each evaluation parameter and the ground grid activate the respective check box.
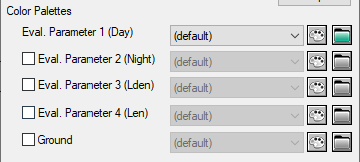
Dialog Grid Appearance, section „Color Palettes“
Color Palette „default“
By default, the color palette „(default)“ is preselected for all grids. The default color palette corresponds with the formerly used grid appearance settings, with respect to the type of grid shown (Raster, Oversampling 1) and the level range.
Color Palette „file“
When loading a file which has been generated using a former version of CadnaA the settings on dialog Grid Appearance will be displayed for the color palette „(file)“. The color palette „(file)“ is stored in the local library of color palettes (see Color Palettes).
Editing a color palette

This button gives a direct access to currently selected local color palette. Subsequently, the color palette can be editing (see Color Palettes). Changes will be applied on closing the dialog Library: Color Palette.
Selecting a color palette

After activation of the check box, a color palette from the local library can be selected from the list box for each evaluation parameter. The text displayed on the list box is the ID of the respective color palette in the local library.
Color palettes from the global library are selected by clicking the file selection symbol. SHIFT-clicking on the file selection symbol opens the local library of color palettes.
Examples
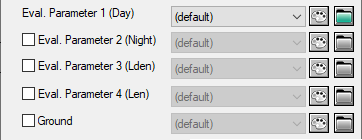 |
The palette „pal_35_85_step_5“ is used for all four evaluation parameters (if any) and the ground grid. |
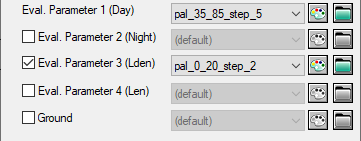 |
The palette „pal_35_85_step_5“ is used for evaluation parameters 1, 2, 4 and for the ground grid. For evaluation parameter 3 the palette „pal_0_20_step_2“ is used. |
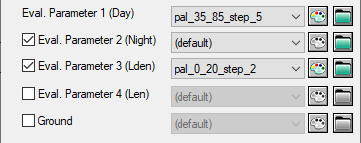 |
Compared to the last setting, now the default color palette is used for the second evaluation parameter. For evaluation parameter 3 and for the ground grid the palette „pal_35_85_step_5“ is still used. |
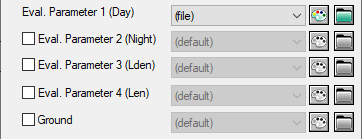 |
When loading a file from a former release of CadnaA, the color palette „(file)“ resulting from this file is used for all evaluation parameters and for the ground grid. REMARK: In this case, the grid appearance corresponds with the appearance in former CadnaA-releases. |
Progressive Colors
This option may have three modes: deactivated (no tick mark), activated (black tick mark), neutral (grey tick mark). In the neutral mode (default setting) the setting for „Progressive Color“ of the respective color palette applies. Thus, if a progressive color has been defined in the color palette it will be used, and vice versa. With this option deactivated, color palettes with progressive colors show use distinct color with transition. With this option activated, color palettes without progressive colors show them, instead.
Grid Points
The option „Grid Points“ enables to mark the locations on the grid where the level has been calculated (selection „Dots“) or of the calculated levels at those locations (selection „Values“).
When displaying the terrain’s height the height in meters is displayed with the option „Values“ selected. The same holds for attribute values resulting from ObjectScan (see Object-Scan).
Level Range
When loading a file created by a former release of CadnaA, the dialog Grid Appearance displays the grid settings for the color palette „(file)“. The lines and areas of equal sound level include - as it was the case with former releases of CadnaA - the upper limit of every value range (i.e the option „Interval Border to Lower Interval (lo < xxx <= hi)“ is activated, see Color Palettes).
Class Width
The value in this box will just have an effect if either the option „Lines of Equal Sound Level“ or „Areas of Equal Sound Level“ is activated. The class width defines the width between adjacent lines of equal sound level.
Lower/Upper Limit
The lower and upper limits define the level range.
Note
The option „Level Range“ should nowadays not be used when defining the grid appearance as it disables the selected color palettes.
Grid legend in 2D and 3D view
The grid legends as being defined can be inserted into the graphics and be printed via the PlotDesigner by use of the object „Symbol“ (see Symbol and PlotDesigner - Cell Types). Furthermore, a grid legend can be added even to the 3D-Special view (see Menu Commands,).
Line Width
Provided the display mode „Lines of Equal Sound Level“ is selected, noise contours can be highlighted by thicker lines in intervals. For example, in order to draw a thicker line in steps of 10 dB, activate the first option „Line Width“ and select „??0.0" from the list box. Here, the question marks serve as wild cards for any other figure. In order to draw a thicker line in steps of 5 dB in addition, activate the second option „Line Width“ and select „??5.0" from the list box. The line widths are specified in tenths of millimeters (mm/10).
Note
As already with the level range, the option „Line Width“ is only used to display grid appearance settings resulting from former CadnaA files. Nowadays, the definition of the line width for each value range is part of the color palette.
Import of old Palette-Files
The button „Import old Palette-File“ enables to load files with color palettes (file extension *.PAL) from former CadnaA releases. The imported color palette is shown on the list box for the evaluation parameter 1 and simultaneously copied to the local library.
This feature can be used to import an arbitrary number of existing color palettes to the local library by multiple import.
Option „for all Variants“
This option is enabled by default. In this case, the same settings for the grid appearance are used for all active variants (see Variants).
By deactivating this option for a distinct variant - after this variant been selected - and specifying a different grid appearance for this variant, this option is automatically deactivated by CadnaA for all other active variants. For these variants, however, the current grid appearance settings are not changed.
Note
In case this option is deactivated (for one or for all variants) and the grid appearance settings match for all active variants, the option is activated by CadnaA for all variants automatically.