Correction based on Wind Statistics
Wind Statistics
With a local wind statistics available this distribution can be used to calculate the meteorological correction in CadnaA.
- Open the dialog Configuration|Industry, select for "Meteorology" the option "Cmet, Co from wind statistics" and click the button "Wind Statistics".
- The dialog Wind Statistics enables to specify the wind frequency in 30° sectors for the assessment period (a year). Enter a value of 50 into the two sectors located next to the North direction.
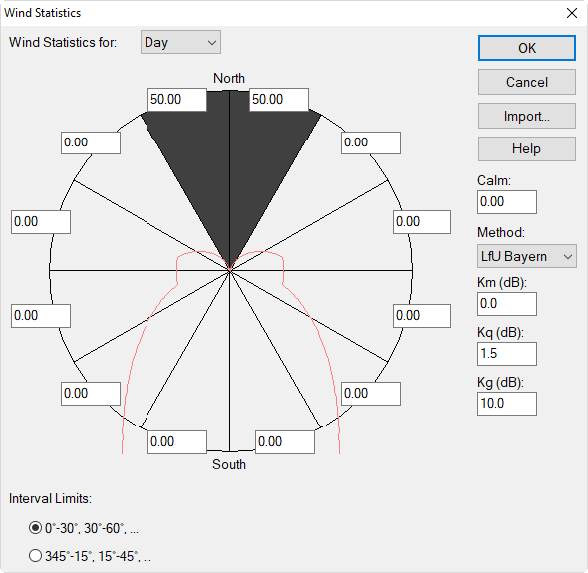
Wind statistics for North wind (= wind from North direction)
Note
The sum of the values entered (wind frequencies) does not need to be 100 as CadnaA normalizes the values entered automatically to the sum.
Method LfU Bavaria
In CadnaA, two methods for calculation of C0 from wind statistics are available:
- method published by the Bavarian Environmental Protection Agency (LfU Bavaria), and
- method published by the Environmental Protection Agency of North Rhine-Westphalia (LUA NRW).
In this example the approach according to LfU Bavaria is used which is:
\(C_0=-10\lg(\frac{T_m}{100}10^{-\frac{K_m}{10}}+\frac{T_q}{100}10^{-\frac{K_q}{10}}+\frac{T_g}{100}10^{-\frac{K_g}{10}})\)
with
- Tm: percentage of annual downwind situations and calmness (inversions) in %
- Km: level difference to the downwind situation in dB
- Tq: percentage of annual cross-wind situations in %
- Kq: level difference of cross-wind situations to the downwind situation in dB
- Tg: percentage of annual upwind situations in %
- Kg: level difference of upwind situations to the downwind situation in dB
The percentages T for downwind, crosswind, and upwind result from the wind frequencies in the following sectors:
downwind: +/-45° in direction of propagation (=90° sector) and calmness,
crosswind: 45° to 135° and 225° to 315° in direction of propagation,
upwind: +-45° opposite to the direction of propagation (=90° sector).
Circular Diagram
The red line in the chart represents the value of the direction-dependent C0 in dB. The outer circle corresponds to C0 = 5 dB. The value per circular sector results from the entire distribution when the ray is pointing from the border of this sector to the center. Upon calculation, the direction-dependent C0 is evaluated for every ray. From this the value of Cmet is calculated.
Example
- Enter a point source with an A-weighted sound power level of PWL=100 dB(A) at (x,y)=(500,500) and four receivers with the following coordinates:receiver to the North: (x1,y1)=(500,600)receiver to the South: (x2,y2)=(500,400)receiver to the West: (x3,y3)=(400,500)receiver to the East: (x4,y4)=(600,500)
- Name the receivers on the receiver’s table (Tables menu) by the letters N, S, W, E according to their direction.
- Define a rectangular calculation area which includes all four receivers.
- Select the command Protocol from the Calculation menu and activate there the option "Write Protocol".
- Start the calculation by clicking the calculator symbol in the tool bar.
- Set the grid spacing to 1x1 m and select the „Lines of Equal Sound Pressure“ (menu Grid, Grid properties or Appearance respectively) and calculate the grid (command Calculate Grid on Grid menu).
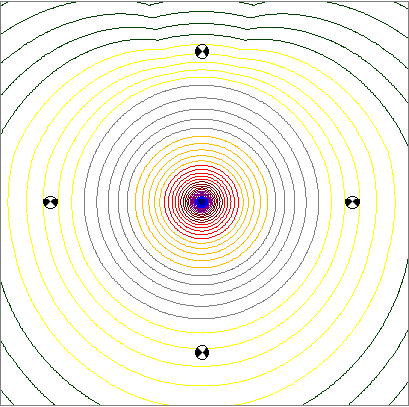
Grid with wind from North and four receivers
- Open the protocol (menu Calculation|Protocol, buttons „Print“ and „Preview“)
- Successively select the protocol for receivers 1 to 4.
The following Cmet-values are displayed on the respective pages:
receiver to the North: Cmet = 2 dB
receiver to the South: Cmet = 0 dB
receiver to the West: Cmet = 0.3 dB
receiver to the East: Cmet = 0.3 dB
For the to the receiver North the average level reduces due to the North wind (= upwind) by 2 dB, for the receivers to the East and West by 0.3 dB. The level at the southern receiver point, situated in the downwind direction remains unchanged. These values result from the wind statistics as shown below.
Receiver North
For the receiver to the North (i.e. upwind from the North):
\(C_0 = -10\lg(\frac{0}{100}+\frac{0}{100}10^{-\frac{1.5}{10}}+\frac{100}{100}10^{-\frac{10}{10}})=-10\lg0.1=10dB\)
and
\(C_{met}=10[1-\frac{10(4+4)}{100}]=10*0.2=2dB\)
Receiver South
For the receiver to the South (i.e. downwind from the North):
\(C_0 = -10\lg(\frac{100}{100}+\frac{0}{100}10^{-\frac{1.5}{10}}+\frac{0}{100}10^{-\frac{10}{10}})=-10\lg1=0dB\)
So:
\(C_{met} = 0dB\)
Receiver West and East
For the receivers to the West and to the East (i.e. crosswind from the North):
\(C_0 = -10\lg(\frac{0}{100}+\frac{100}{100}10^{-\frac{1.5}{10}}+\frac{0}{100}10^{-\frac{10}{10}})=-10\lg0.71=1.5dB\)
and
\(C_{met}=1.5[1-\frac{10(4+4)}{100}]=1.5*0.2=0.3dB\)
Deviating Nord Direction
In case the North direction in the CadnaA file does not correspond with the North direction assumed by default (N = top), a North arrow can be inserted using the object "Symbol" pointing towards the correct North direction. Then, CadnaA rotates the North direction of the wind statistics into the new North direction.
-
Select the object "Symbol" symbol (
 ).
). -
Drag with the mouse a small area (square) on the CadnaA main window on.
- Open the edit window of the symbol (with the right mouse button in the edit mode or with a left mouse button in the edit mode).
- Select from the list on dialog "symbol" the item "North Arrow 1" and enter an angle of 45°.
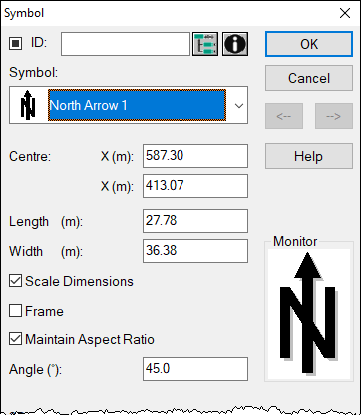
Symbol „North Arrow 1“ at an angle of 45°
- Close the dialog by OK and restart the grid calculation (menu Grid|Calc Grid).
The result shows the lines of equal sound level based on the North direction rotated by 45 degrees. Thus, the resulting Cmet-values differ from those in the preceding situation (see protocol).
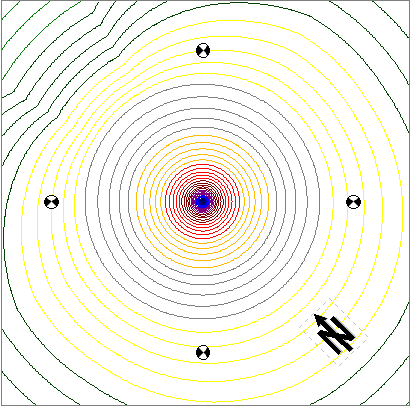
Grid with North direction rotated by 45°
Note
Note that the assignment of the symbol „North Arrow“ is based on the language-specific symbol name. Therefore, when changing the language setting the symbol selection is no longer valid. In this case, reselect the symbol (see also chapter Symbol in the CadnaA Reference Manual).