Sound Level Spectra
Via the libraries Sound Level (on menu Tables|Libraries (local) and (global)) spectra of the sound pressure (SPL) and the sound power level (PWL) for industrial sources (point, line, and area sources) are organized, regardless of their spectral weighting (linear, A, B, C or D weighting). The libraries can be extended by users.
Note
The noise level spectra in the global library supplied with CadnaA result from the VDI guideline 2571 2571-76 specifying typical indoor level spectra for a variety of activities.
When referencing to a spectrum from the global library in a project, CadnaA will generate a copy of this spectrum in the local library of sound levels. The reference to a spectrum is established by its ID which is, therefore, mandatory to enter.
Furthermore, spectra from the global library can be copied to the local library by clicking the button „--> Local Lib.“.
Accessing Sound Level Spectra
In the dialog of point, line and area sources, sound level spectra are accessed by clicking the file selector symbol  in line PWL/PWL‘/PWL“ (see Common Input Data).
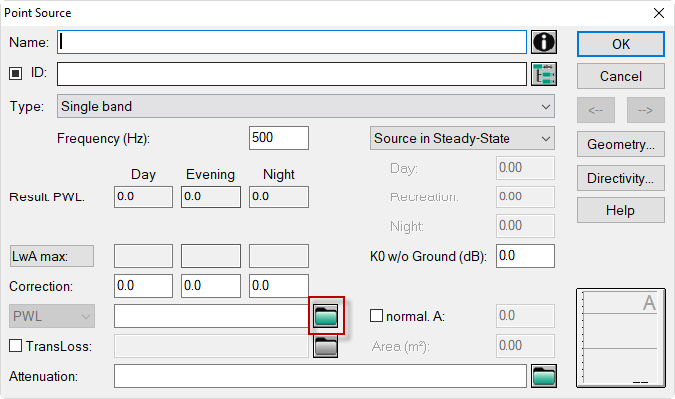
dialogue Point Source: The file selector symbol is outlined in red, clicking the symbol gives access to sound level spectra (local or global)
The following modifications are available:
- clicking the file selector symbol in line PWL/PWL‘/PWL“ gives access to the local library Sound Levels or
- holding the SHIFT key pressed while clicking the file selector symbol in line PWL/PWL‘/PWL“ gives access to the global library Sound Levels.
Export/Print of Noise Level Spectra
The noise level spectra from the libraries can - like any other table - by copied to the clipboard by clicking the button "Copy" or be printed or exported (see Text Files (.txt, .rtf)) by using keywords (see Table in the manual "Attributes, Variables, and Keywords"). Printing and exporting using this keyword occurs just for the local library:
#(Table, LibL)
Entering new spectra
New level spectra can be entered in two ways:
-
starting from the object dialog of point, line and area sources by clicking the file selector symbol
in line PWL/PWL‘/PWL“ (with or without holding down the SHIFT key) and entering the new spectrum in the particular library, or -
via the menu Tables|Libraries (local) or (global)|Sound Levels.
Note
In order to enter several spectra it is recommended to enter the spectra via the Tables menu and to assign the spectra to each of the respective sources afterwards.
Regarding the general handling of object tables and the input of new data records via the context menu, see Object Tables.
Spectra - as with other kinds of library objects - can be edited directly in the respective table or - after a double click in a table row - be entered on the dialog Spectrum.
Dialog Spectrum
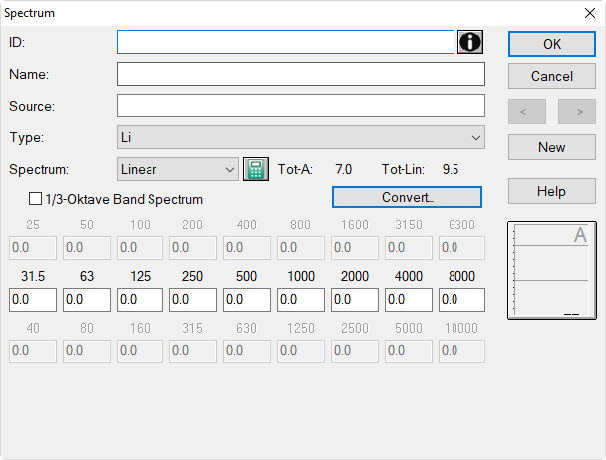
ID
It is mandatory to enter an ID for each spectrum. Please consider the respective rules for the ID (see Dialog Options Name, ID, INFO, ObjectTree, Master in the manual „Introduction to CadnaA“). In particular with library objects, a character is mandatory as the ID‘s first character.
Note
For example, the first character may be used as an identifier for the type of spectrum: S = sound pressure, P = sound power, T = insulation (transmission loss), A = absorption followed by a number, for example: S001, S002, P001, P002, etc. (see Changing Column Content).
Name
description of the data's origin
Type
selection of the type of spectrum. Available are:
- Li (standing for an interior SPL)
- Li from interior sources (also an interior SPL, calculated)
- Lw (standing for the sound power level PWL)
- Lw from Lp + area + nearfield correction (also a PWL, calculated)
- Lw from Lp + distance + sphere partition (also a PWL, calculated)
For more details on each spectrum type see below.
Spectrum
Prior to input a the spectral values select the weighting type of spectrum (linear, A, B, C, D). Toggling the weighting type does not alter the spectrum.
Note
Alternatively, on the column „Weight.“ of the table Sound Levels the corresponding letter (ABCD) can be entered. The space will select the setting „linear“.
Pocket Calculator Symbol

Via this symbol the present spectrum can be modified (see Modify Spectrum).
Tot-A / Tot-Lin
shows the A-weighted and the linear (unweighted) total levels of the spectrum
Option „1/3 Octave Band Spectrum“
after activation a third-octave spectrum can be entered
Button „Convert“
see Spectra, Conversion of Spectra
Octave or Third-Octave Bands
Enter the level in the each octave or 1/3-octave band here. Consider that a level of 0 dB does not mean „no input“. Therefore, when having no data in a frequency band available, enter a space or keep the input box empty. In this case, the band will be considered as not valid.
Note
When a value in an octave or 1/3-octave band is missing for a source, the resulting receiver level after calculation is not shown on the dialog Receiver for the respective frequency band.
Arrow Buttons <-|->
to move to the next/previous data record
Button "New"
generates a new table row below the row currently selected
Spectrum Monitor
 |
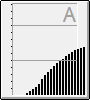 |
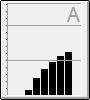
The spectrum monitor in the lower right corner of the dialog shows the shape of the octave or third-octave frequency spectrum as a bar chart. Clicking on the graph will cycle among linear display and A, B, C or D weighting. The emission of a source is not affected by changing this display.
Emission Spectra
In CadnaA, sound power spectra used to describe the spectral emission of sources can be entered directly or be calculated from measured sound pressure level spectra. It is not required, therefore, to convert sound pressure level spectra and measuring distances to sound noise power level spectra in another software (e.g. a spreadsheet software), since this can be done in CadnaA already.
Spectrum Type „Li“
By selecting the spectrum type „Li“ it is specified that this spectrum is an interior sound pressure level to be used, for example, to calculate the sound radiation by a building. The input data may result from measurements or from calculations.
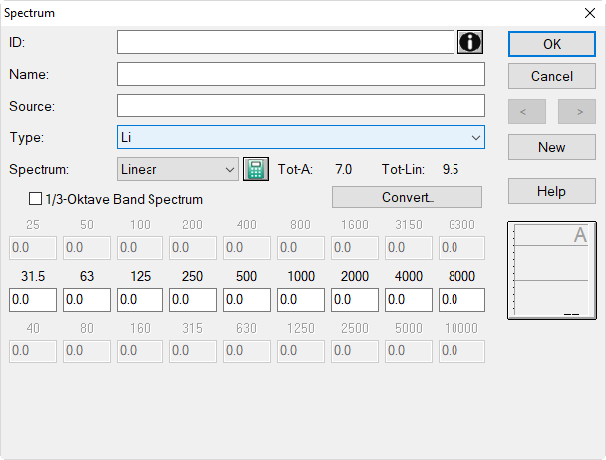
Spectrum Type "Li" selected
Spectrum Type „Li from interior sources“
By selecting this spectrum type the noise pressure level spectrum inside a room can be calculated from the sound power level spectra of several sources, the surface area of the room and it‘s sound absorption coefficient.
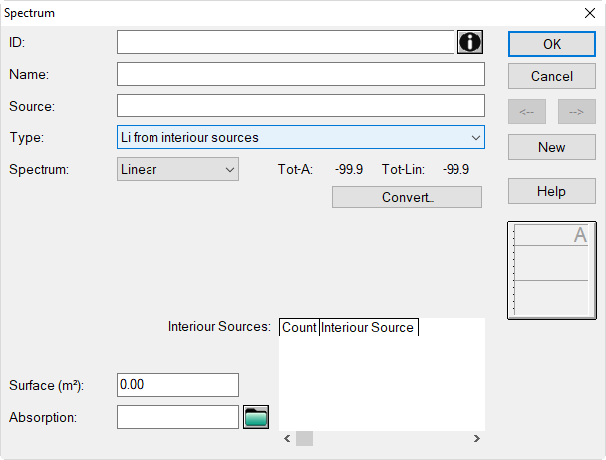
Spectrum Type „Li from interior sources“ selected
The calculation procedure applied follows the statistical theory of sound reverberation in rooms. For each frequency band, the following applies:
\(SPL_i=PWL-10\lg(\frac{A}{m^2})+6\text{dB}=L_W-10\lg(\frac{\alpha*S}{m^2})+6\text{dB}\)
with
- \(SPL_i\): interior level in the room in the frequency band in dB
- \(PWL\): sound power level of all sources in the frequency band in dBA
- \(A\): equivalent sound absorption area in the frequency band in m²α
- \(\alpha\): mean absorption coefficient of the room surfaces
- \(S\): area of the room surfaces in m²_
Both, the sound power level in the sub-table, and the sound absorption coefficient can be entered as a numerical value or be referenced to a spectrum (see subsequent examples).
Example 1: input by single values
In this example, all input data is entered as numerical values. In this case CadnaA applies the entered value for each octaves of the respective input parameter. The first interior sources has a PWLlin,oct=85 dB, and the second a PWLlin,oct=80 dB each. The total surface area of the room is S= 1000 m² with a mean sound absorption coefficient of αoct=0.5.
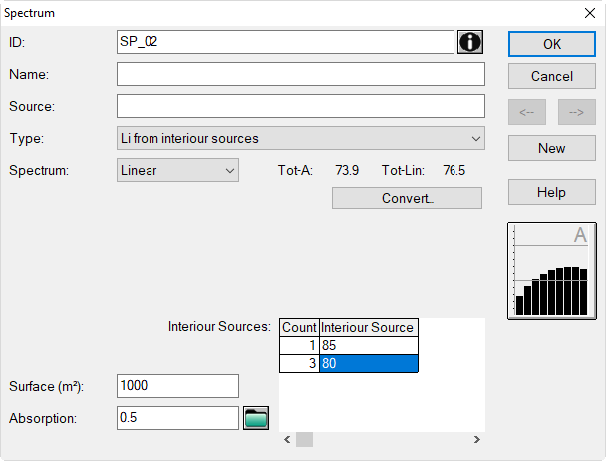
The displayed total levels of Tot-Lin=73.9 dB(A) and Tot-Lin=76.5 dB result from:
| Value | 31.5 | 63 | 125 | 250 | 500 | 1k | 2k | 4k | 8k |
| PWL, Q1 | 85 | 85 | 85 | 85 | 85 | 85 | 85 | 85 | 85 |
| PWL, Q2,i | 80 | 80 | 80 | 80 | 80 | 80 | 80 | 80 | 80 |
| 10 lg 3 | 4.8 | ||||||||
| PWL, Q2 sum | 84.8 | 84.8 | 84.8 | 84.8 | 84.8 | 84.8 | 84.8 | 84.8 | 84.8 |
| PWL,sum | 87.9 | 87.9 | 87.9 | 87.9 | 87.9 | 87.9 | 87.9 | 87.9 | 87.9 |
| A=α * S | 500 | 500 | 500 | 500 | 500 | 500 | 500 | 500 | 500 |
| SPLi,oct | 66.9 | 66.9 | 66.9 | 66.9 | 66.9 | 66.9 | 66.9 | 66.9 | 66.9 |
| A-Weight. | -39.4 | -26.2 | -16.1 | -8.6 | -3.2 | 0.0 | 1.2 | 1.0 | -1.1 |
| SPLiA,oct | 27.5 | 40.7 | 50.8 | 58.3 | 63.7 | 66.9 | 68.1 | 67.9 | 65.8 |
Results: Tot-A = 73.9 dB(A); Tot-Lin = 66.9 + 10 lg 9 = 76.4 dB
Note
CadnaA calculates internally with full precision while these values are rounded to the 1st decimal. Therefore, differences may occur for decimals.
Example 2: input of spectral data
In case spectra of the sound power level for each type of source in the room are available from the spectral library already, these can be referenced by their ID via the sub-table of interior sources.
Note
These sound power level spectra may have been entered using one of the options described below, e.g as a sound power level directly or being calculated from the measured sound pressure level.
After selecting the spectrum type „Li from interior sources“, three new lines are inserted on the sub-table „Interior Sources“ via it‘s context menu. Double-clicking into a row the number of sources and their sound power level spectrum can be edited or selected resp. Again, access is possible either to the local or the global library of sound levels (holding down the SHIFT key with the global library).
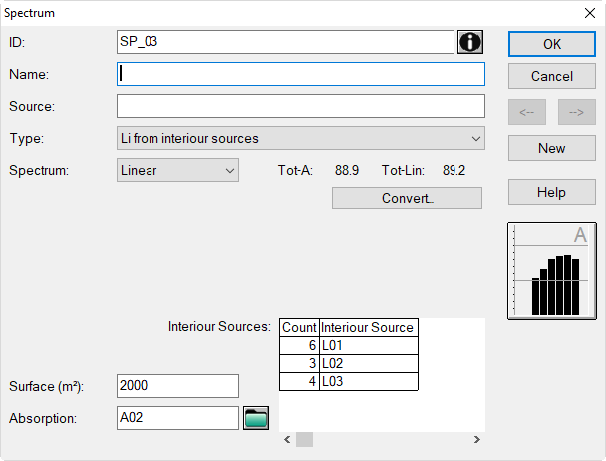
After selection, the sound power level spectra are referenced by their ID in the sub-table. Clicking the file selector symbol in the row „Absorption“ offers to reference an absorption spectrum from the local or global library.
Entering the total room surface (in m²) will display the resulting interior level spectrum on the spectrum monitor. Click OK to confirm the input data and to display the spectrum in the library table. On the library table, the type designation „Li (c)“ indicates that the spectrum was calculated ("c") from other spectra. Consider that octave values of the spectrum cannot be edited in the table.
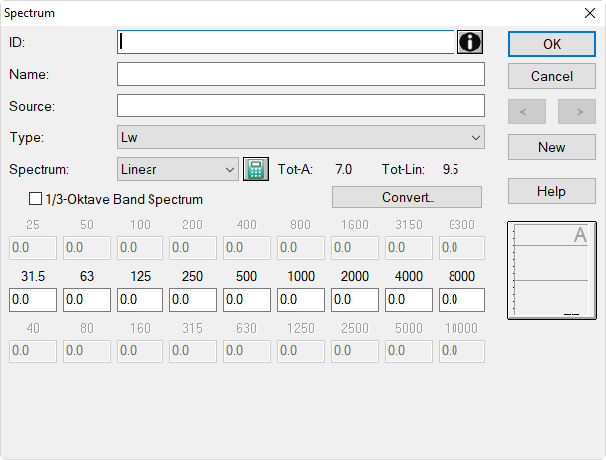
Spectrum Type „Lw“
By selecting the spectrum type „Lw“ is determined that this is a sound power level spectrum - for example, of a sound-emitting point source.
Spectrum Type „Lw from Lp+area+nearfield correction“
This spectrum type enables to enter sound pressure levels measured on an envelope or on any other sound transmitting surface (e.g. in an opening). From this information the sound power level is calculated.
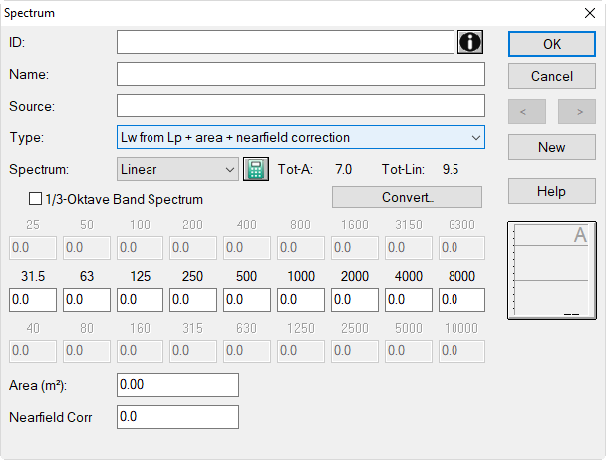
A value entered in input box „Nearfield Corr“ is added:
\(PWL=SPL+10\lg(\frac{S}{m^2})+\text{nearfield correction}\)
with:
- \(PWL\): sound power level at frequency f in dB
- \(SPL\): averaged sound pressure level on the surface S at frequency f in dB
- \(S\): surface S of the envelope in m²
Near Field Correction
The input box „Nearfield Corr“ enables to take into account a global correction in case
- sound rays (better: the sound intensity vector) do not pass the envelope perpendicular (causing an „angle error“) or
- the sound pressure level was measured near the source‘s surface, thus, in the near field of the source (distance r << λ wavelength), causing a „near field error“.
In both cases, the sound power level calculated from the sound pressure level (being a scalar) will be too large, as energy contributions increase the sound pressure level without having passed the envelope in perpendicular direction, or because the reactive power in the near-field was not considered when calculating the radiated sound power.
Note
The standards ISO 3744/3745/3746 provide information regarding the magnitude of both errors and on how to reduce them (see 3744-10 3745-2012 3746-2010).
Note
When measuring the sound intensity rather than the sound pressure level, both errors are avoided. Regarding the determination of the sound power level by sound intensity measurements, see ISO 9614 (see 9614-2002, and the notes at the end of this chapter).
Example 3
On the envelope of a machine (e.g. a pump) the following average sound pressure levels were measured:
| Value | 31.5 | 63 | 125 | 250 | 500 | 1k | 2k | 4k | 8k |
| $\overline{L_{p,lin}}$ | - | - | 70 | 74 | 76 | 80 | 84 | 83 | 80 |
During the measurement it was ensured that the measuring surface was outside of the near field of the source (resulting in a near field error of 0 dB). In CadnaA the input values are:
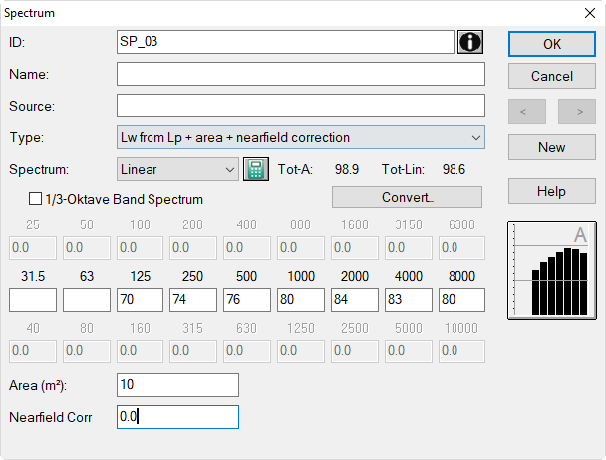
The linear and A-weighted sound power level result as follows:
| Value | 31.5 | 63 | 125 | 250 | 500 | 1k | 2k | 4k | 8k |
| $\overline{L_{p,lin}}$ | - | - | 70 | 74 | 76 | 80 | 84 | 83 | 80 |
| 10 lg 10 | - | - | 10 | ||||||
| PWLlin,oct | - | - | 80 | 84 | 86 | 90 | 94 | 93 | 90 |
| A-Weight. | -39.4 | -26.2 | -16.1 | -8.6 | -3.2 | 0.0 | 1.2 | 1.0 | -1.1 |
| PWLA,oct | - | - | 63.9 | 75.4 | 82.8 | 90 | 95.2 | 94 | 88.9 |
Results: Tot-A = 98.9 dB(A); Tot-Lin = 98.6 dB
Example 4
Inside a door opening with a cross section of S=2 m² the following sound pressure level was measured by scanning the opening area:
| Value | 31.5 | 63 | 125 | 250 | 500 | 1k | 2k | 4k | 8k |
|---|---|---|---|---|---|---|---|---|---|
| SPLlin | 48 | 53 | 63 | 65 | 70 | 72 | 72 | 67 | 60 |
Assuming a diffuse field in the room behind the door opening the angle error is approximately -3 dB. This results in CadnaA in the following input data:
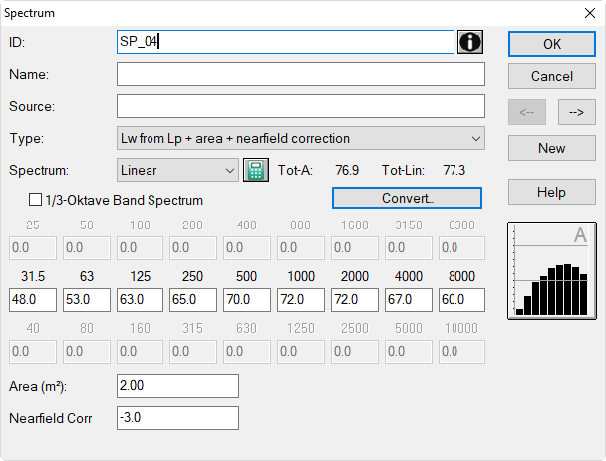
Also with this spectrum type, the type designation „Lw (c)“ in the library table indicates that the spectrum was calculated ("c") from other spectra. Consider that octave values of the spectrum cannot be edited in the table.
More information on the near field correction
- The input of -3 dB for the „near field correction“ is based on the assumption that the incidence of sound occurs at all angles from the source side to the open surface S. This is - for example - the case at an open door or gate with a diffuse sound field in the room behind.
- In the cross section of an outlet with sound absorbing treatment (e.g. a sound absorbing duct lining or with a silencer), transversal modes are suppressed, and the angle correction („near field correction“) is 0 dB. In an acoustically hard duct intermediate values between 0 and -3 dB may apply depending on the propagation path source-opening and the duct‘s diameter or cross section.
Spectrum Type „Lw from Lp+distance +sphere partition“
Besides the measurement procedure making use of an enveloping surface (see above) in practice a measuring distance is used being large compared with the source dimensions. When assumed furthermore that the source‘ radiation is non-directional, the sound pressure level can be measured at only a single point at a distance. When the radiation is directional, however, it has to be measured at several points and at the same distance from the source, averaging the level spectra from different directions energetically.
Assuming the radiation does not occur into full sphere (solid angle Ω=4π), but into a proportion n% of the full sphere (for example, into the half sphere, i.e. solid angle Ω=2π), the resulting sound power level PWL from the measured sound pressure level SPL is:
\(PWL=SPL+10\lg(\frac{4\pi r^2}{m^2})+10\lg(\frac{n\%}{100\%})\)
with
- \(PWL\): sound power level at frequency f in dB
- \(SPL\): sound pressure level at distance r at frequency f in dB
- \(r\): measuring distance in m
- \(n\%\): proportion of the full sphere in %
Example 5
The sound pressure level is measured on a reflective floor at a distance of 5 m from a source (representing a type of point source). A constant emission spectrum with a constant, linear spectrum of PWLoct=77 dB in the frequency range 125 to 4000 Hz is assumed.
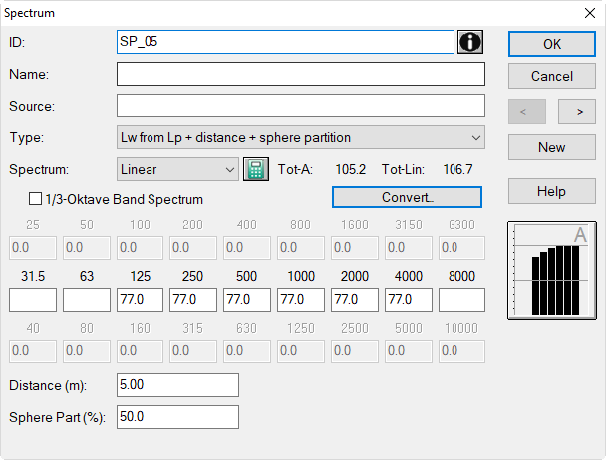
The linear (unweighted) sound power level PWLlin („Tot-Lin“) per octave is given by:
\(PWL_{okt}=SPL+10\lg(\frac{4\pi*5^2}{m^2})+10\lg(\frac{50\%}{100\%})=(77+25-3)\text{dB}=99\text{dB}\)
The linear sum level of the sound power calculates from:
\(PWL_{sum}=99+10\lg6=106.8\text{dB}\)
The resulting A-weighted sound power level PWLA („Tot-A“) results from:
| Value | 31.5 | 63 | 125 | 250 | 500 | 1k | 2k | 4k | 8k |
| SPL (at r=5 m) | - | - | 77 | 77 | 77 | 77 | 77 | 77 | - |
| A-Weight. | -39.4 | -26.2 | -16.1 | -8.6 | -3.2 | 0.0 | 1.2 | 1.0 | -1.1 |
| 10 lg (4π∗ 5²) | 25 | ||||||||
| 10 lg (50/100) | -3 | ||||||||
| PWLA,oct | - | - | 82.9 | 90.4 | 95.8 | 99 | 100.2 | 100 | - |
Result: PWLA=105.2 dB(A) (= Tot-A)
Example 6
Assuming that the radiation occurs into the full sphere (i.e. with a solid angle Ω=4π) and with the other data as before, it results a sound power level being 3 dB larger:
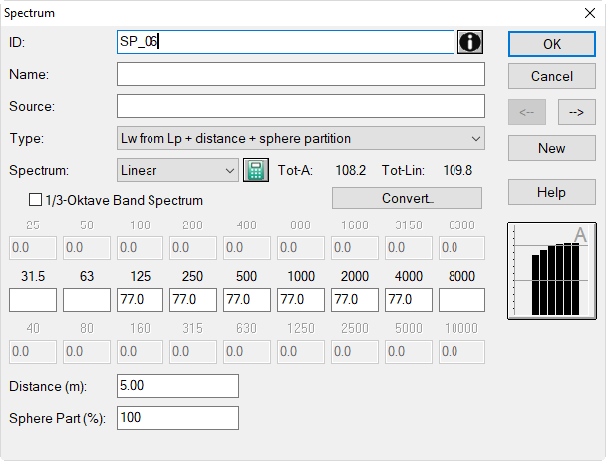
Also with this spectrum type, the type designation „Lw (c)“ in the library table indicates that the spectrum was calculated ("c") from other spectra. Consider that octave values of the spectrum cannot be edited in the table.
Additional Information
The sound power P radiated by a point source results from the sound intensity  , which passes through the envelope surface
  (measuring surface) in the direction of the surface normal:
\(P=\int\vec{I}d\vec{S}\)
or in notation of levels:
\(PWL=\overline{SPL_I}+10\lg(\frac{S}{m^2})\)
with
- PWL: sound power level in dB
- SPLI: average sound intensity level on the envelope in the direction of the surface normal in dB
- S: surface of the envelope in m²
In case the measurement occurs in the far field of the source (sound pressure and particle velocity are in phase), and assuming that the sound velocity vector is inciding perpendicular to the measurement envelope, the sound intensity measurement can be replaced by the measurement of the sound pressure level:
\(P=\int \frac{p^2}{\rho c}dS\)
or in notation of levels:
\(PWL=\overline{SPL}+10\lg(\frac{S}{m^2})\)
with
- PWL: sound power level in dB
- SPL: mean sound pressure level on the envelope in dB
- S: surface of the envelope in m²
and by assuming \(\rho c = \rho_0 c_0\).
The measurement of the sound pressure level (being a scalar) when determining the sound power may include a near field error and an angular error. The former can be reduced by a sufficiently large distance of the envelope surface from the source (distance > 1 m). The second error is more relevant at irregularly shaped sources (machines) because the envelope cannot be adjusted to the source‘s surface in the very detail. This angular error is the smaller, the greater the measurement distance is and whether the shape of the measuring envelope is well adapted to the shape of the sound field. With spherical or semi-spherical envelopes this will hold at distances r >= 2*lmax, where lmax is largest dimension of the source.
With box-type („cuboid“) measuring envelopes the following approximation can be given for the angular error Pro-1999:
\(\epsilon'_W\approx1.36*\lg(\frac{S}{d^2})\)
with
- \(\epsilon'_W\): angular error in dB
- \(S\): surface of the envelope in m²
- \(d\): measuring distance in m
In CadnaA, this correction must be entered as a negative value because the "near field" is added.
Furthermore, according to the measurement standards (see 3744-10 3745-2012 3746-2010) the corrections K1 and K2 have to be taken into account. K1 is used to correct for the influence of background noise, while K2 intends to correct for reflections inside the room where the measurement takes place (so-called „environmental correction“).