Diagrams (SDC/T)
This command on the Options menu offers to define the display settings for the sound decay curve (SDC) according to VDI 3760 and for the reverberation time T (accord. to Sabine or Eyring). Furthermore, the corresponding resulting diagrams are selected via this command.
Note
Upon SDC/T calculation always both, the sound decay curve and the reverberation time are calculated - independently from what presently is displayed. This ensures that the reverberation time and the sound decay curve always correspond with the present room parameters (see Room). Thus, the commands on the menu Options|Diagrams (SDC/T) or the symbols on the symbol bar just refer to the graphical representation.
The dialog to display the reverberation time or the sound decay curve has a specific symbol bar with the following options & symbols:
List Box:
 |
List Box for Selection of a Curve: In a diagram up to five different sound decay or reverberation time curves can be defined (see dialog Paths + Reverberation Times, see below). This list box enables to select the current sound decay or reverberation time curve. All further modifications refer to this curve (see section „Sound Decay Curve“ and „Reverberation Time“, both below). |
and the following symbols:
 |
Copy the current Diagram to the Clipboard: Clicking this symbol copies the SDC- or T-diagram (depending on what is presently selected) to the clipboard. The clipboard's content can be pasted into any other application. |
 |
Import Path: Measured results can be imported from a measurement device or from a file. This enables to analyze measured sound decay or reverberation time curves. This is primarily useful when an existent situation and the need for an additional acoustical treatment shall be assessed. Depending which mode is selected, the import dialog for sound decay curves or the import dialog for reverberation time opens. |
 |
Calculate Sound Decay Curve or Reverberation Time (alternatively via the command Calc SDC/T on the Calculation menu) |
 |
Open Dialog Room Parameters (see Room) |
 |
Open Dialog Paths + Reverberation Times (see below) |
 |
Open Dialog SDC-Diagram or Reverberation Time Diagram for optional settings (see below) |
 |
Display Sound Decay Curve |
 |
Display Reverberation Time Diagram |
Sound Decay Curve (SDC-Diagram)
Selecting this sub-command displays the SDC diagram.
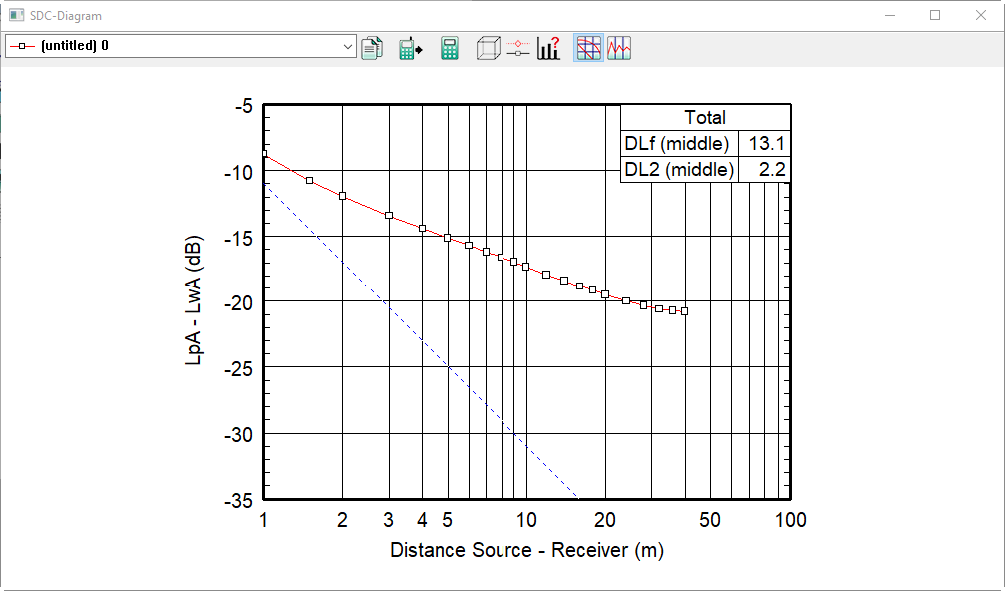
Dialog SDC-Diagram (menu Options|Diagrams)
The SDC diagram shows the attenuation in dB (as the difference between the sound pressure level LpA and the sound power level LwA) depending on the logarithm of the distance from source to receiver (in m). Up to five curves can be displayed simultaneously.
- Curve of the free field propagation: By default, the SDC curve resulting from free field propagation is displayed as a hatched (where ΔL = 1/(4 π r²), resulting e.g. in ΔL =-24,9 dB at a distance of 5 m).
- Current Curve: When several curves are displayed in the SDC diagram, all changes (e.g. modification of absorbing surfaces) refer to the curve selected. A subsequent recalculation changes the selected curve. With calculation method "VDI 3760" selected the currently selected sound decay curve is used for the calculation of the level distribution in the room.
- Setting the current curve: To set a curve as a current curve, select it from the list of curves on this dialog SDC-Diagram. All further operations refer to this curve.
Import Path

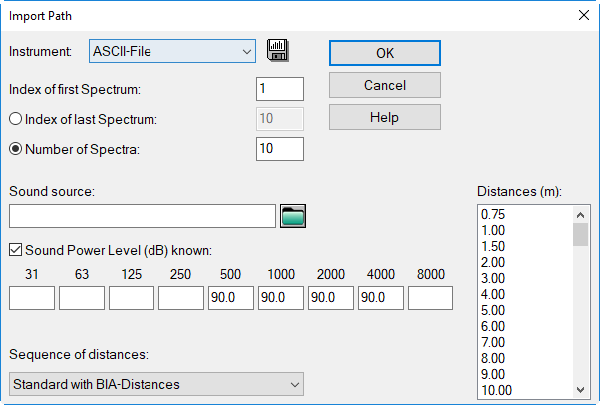
On this dialog the options for the import of sound propagation curves are specified. Curves resulting from successive import operations from a measurement device are displayed in an arbitrary order in conjunction with calculated curves. This enables - for example - to compare sound decay curves from a situation without any additional acoustic treatment with situations with different treatments in a single diagram.
-
Instrument: Select from the list of available measurement devices the export files of which can be imported by CadnaR. In case your device is not available export the data into a text file and import the data using the option "ASCII-File".
- examples for ASCII import files (SAK_SDC_125_4000.txt and SAK_SDC_31.5_8000.txt): The spectral assignment occurs via the band center frequencies in the first data row. Frequency bands not available in CadnaR will be ignored.
Example
Path: Import
-
Spectrum: Specify the number of the first and the last spectrum or - alternatively - the number of the first spectrum and the number of spectra of measured sound decay curves.
- Box "Sound Source": The sound power level spectrum in octave band width of the source being used for measurement of the sound decay curve can be entered or selected from the library of sound power levels. Clicking the file selector symbol gives access to the table Sound Power Level.
-
Sequence of distances: Every spectrum is determined using a specific distance from source to measurement location. The following series of distance intervals are available:
- Standard with BIA-distances: The distances at 0.75 m and 1.5 m also are included as recommended in the corresponding BIA-worksheet.
- Standard: These are the distance intervals as mentioned in the report BAU Fb 621 "Schallausbreitung in Arbeitsräumen" which is also specified in VDI 3760.
- logarithmic: The sequence is based on a logarithmic distances using a factor of 2 between two neighboring locations.
-
Distances (m): This box displays the distance intervals (in m) of the selected series. In case a distinct distance of a series was not measured (e.g. due to a local machine or other fittings) this distance can be deactivated by clicking it with the mouse. These selected values are highlighted.
- button OK: When having specified all options the import operation is started by clicking OK.
Editing the SDC diagram settings
On this dialog the options for the representation and analysis of the SDC diagram are specified.
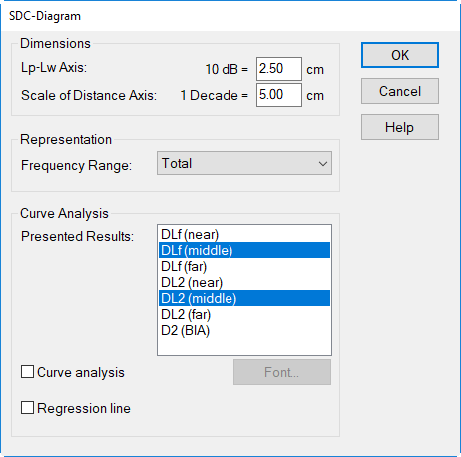
Editing the SDC diagram
By default, the options selected correspond to those specified in VDI-guideline 3760.
-
Dimensions:
- dimension of the LpA-LwA axis per 10 dB in cm
- scale of the distance axis per decade in cm
-
Representation: Selection of the frequency range, either total range (in octaves) or or for a single octave
-
Curve Analysis: The parameters to be presented for the curve analysis and distance ranges. Parameters:
-
DLf level excess above free-field level in dB (see VDI 3760)
-
DL2 level reduction per distance doubling in dB
-
Distance Ranges:
- near region: 1 m <= r <= 5 m
- middle region: 5 m < r <= 16 m
- far region: 16 m < r <= 64 m
-
DL2 (BIA) level reduction accord. to German noise prevention worksheet 03-234 (ZH1/564.16)
-
-
option „Curve analysis“: When this option is active, parameters according to VDI 3760 for assessment of the room acoustical quality are displayed below the SDC diagram.button "Font": The font, font type and the font size for of the analysis table can be selected.
- option „Regression line“: When this option is active, three regression lines for all three regions of the sound decay curve are calculated and displayed.
Diagram Reverberation Time
The reverberation time diagram is displayed when selecting this sub-command. The reverberation time shows the reverberation time (in s) over frequency (in Hz) calculated using statistical theory.
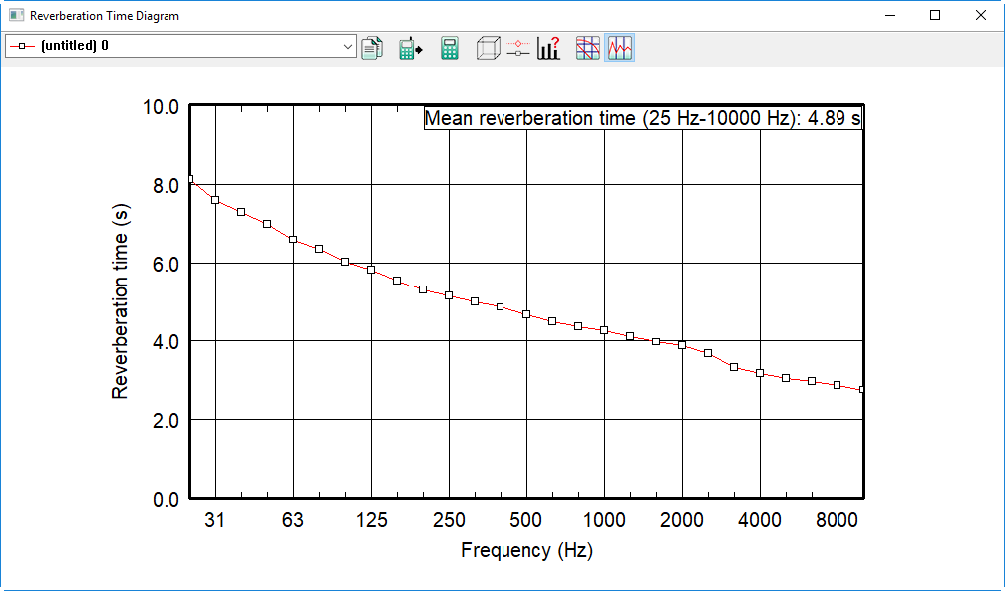
Dialog Reverberation Time (menu Options|Diagrams)
- Current Curve: When several curves are displayed in the T diagram (up to five curves are possible), the selected curve is the current curve where all further modifications refer to (e.g. (e.g. modification of absorbing surfaces). A subsequent recalculation changes the currently selected curve.
- Setting the current curve: To set a curve as a current curve, select it from the list of curves on this dialog. All further operations refer to this curve.
Import Reverberation Time
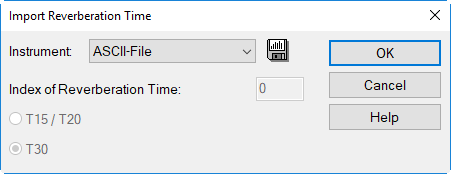
On this dialog the options for import of reverberation time data is specified. Consecutive import operations for separate curves selected will display the curves all together.
-
Instrument: The option "ASCII file" is selected by default. Export the data into a text file and import these data using the option "ASCII file".
- examples for ASCII import files (T_100_8000.txt and T_125_8000.txt): The spectral assignment occurs via the band center frequencies in the first data row. Frequency bands not available in CadnaR will be ignored.
Example
Path: Import
-
Reverberation Times T15/T20 or T30 (not for ASCII import): By definition, the reverberation time T corresponds to the time interval in which the sound pressure level drops by 60 dB after turning off the sound source. By measurement devices, however, T15/T20 or T30 are evaluated. Depending on whether a decrease of the decay curve by 20 dB or by 30 dB has been evaluated the readings are called T20 or T30.
- button OK: Clicking OK displays a dialog for the selection of an ASCII file.
Editing the diagram Reverberation Time
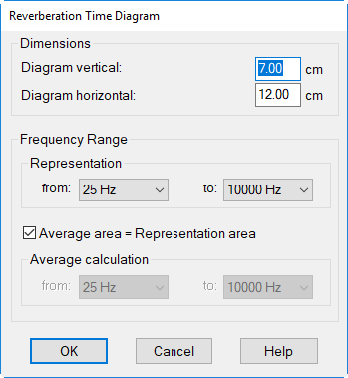
In this dialog the options for the representation and analysis of the reverberation time diagram are specified.
Editing the reverberation time diagram
- Dimensions: vertical/horizontal in cm
- Frequency Range: Representation: from min. freq. 100 Hz to max. freq. 6300 Hz (or for a single octave only)
-
Option "Average area = Representation area":
- activated: The specification of the mean reverberation time (in s) on the right upper corner of the reverberation time diagram refers to the same frequency range as used for display of the curve in the diagram. In this case, the input of the delimiting frequencies is deactivated.
- deactivated: In this case the frequency range for the calculation of the mean average value can be selected. The mean reverberation time refers to the specified frequency range which does not require to correspond with the frequency range used in the diagram.
Paths + Reverberation Times
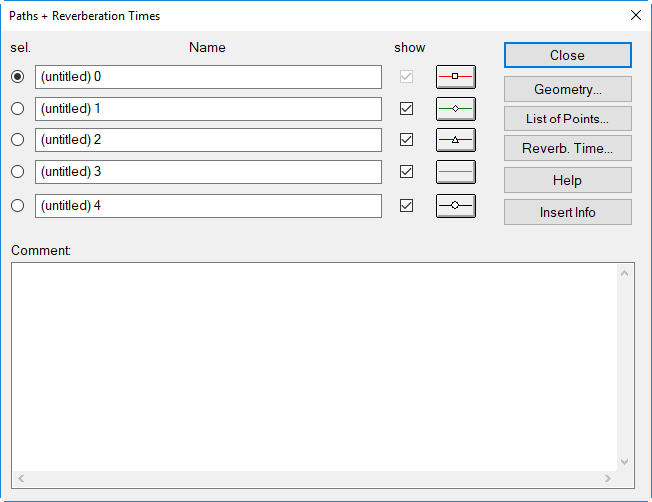
The dialog Paths+Reverberation Times is selectable from the menu Options|Diagrams or - with the SDC or T diagram displayed - from the symbol on the respective symbol bar.
Dialog Paths+ Reverberation Times
Dialog options
- Option "selected": sets the selected curve as "current curve"
- Name: A name can be entered for up to five curves. Per default, the names "(untitled) 0..4" are used. The name may have a length of 30 characters maximum.
- Option "show": Provided a calculated curve exists, it can be selected which of the curves hall be displayed in the SDC or reverberation time diagram. Up to five SDC/T curves can be displayed at the same time in the diagram. Not calculated curves are not shown either.
-
Line Style & Marker: The each level class the color, the line width in (mm/10), and the line style can be defined. The dialog range "Marker" on dialog Line Style is just available for the sound decay curves or for the reverberation time, but not however for grid lines (e.g.
 ).
). -
Comment: An individual comment can be entered for each curve 0..4.
-
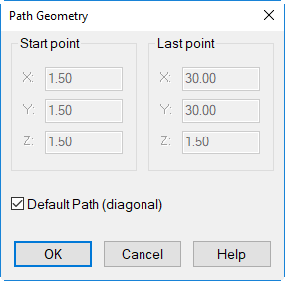
button „Geometry“:
-
option "Default Path (diagonal)" activatedIn this case the path for the calculation of the sound decay curve extends diagonally across the room at 1.5 m height, starting from the lower left corner of the room, at 1.5 m distance from the lateral walls. This corresponds to the measuring path as specified in VDI-guideline 3760 for this room geometry. The calculation of the sound decay curve occurs at the distances given in VDI 3760. At each receiver point all reflections are summed up for each frequency band until the break condition of 0.5 dB is met.
-
option "Default Path (diagonal)" deactivated When this option is deactivated any path geometry can be defined by specifying the coordinates of the start point and the last point of the path (the first point being the source location). The last point is used to specify the direction of the path. The distances refer to the distances between source and path points.
-
Note
The source location has a minor influence on the excess level.
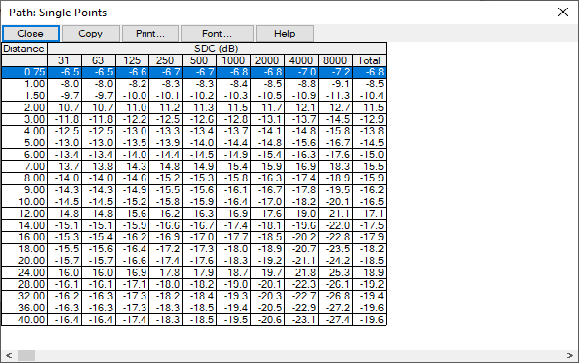
- button „List of Points“: The table Path: Single Points lists levels at each location along the path for each octave band and for the A-weighted level of the presently selected sound decay curve (SDC).
-
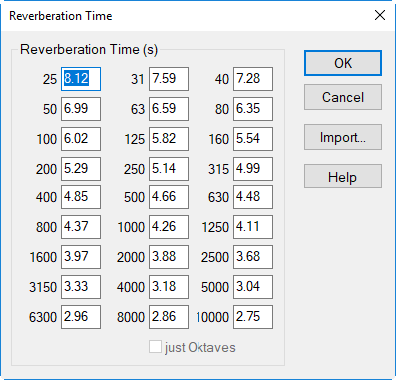
button „Reverb. Time“: On dialog Reverberation Time the calculated reverberation times (in s) are displayed.
- Button "Import": Clicking this button enables to import reverberation time data (see Import Reverberation Time in this chapter).
-
button "Insert Infos": Clicking this button pastes the following configuration settings into the comment box:
- Calculation Method
- Calculation of Equ. Absorption Area A
- Use Absorption of Fittings Y/N
- Use Air Absorption Y/N
- Break Condition
- Air Absorption (Temp./r.F.%)
- Room dimensions (m)
- Fitting density q (1/m)Please consider that clicking the button "Insert Infos" overwrites any existing comment without request.
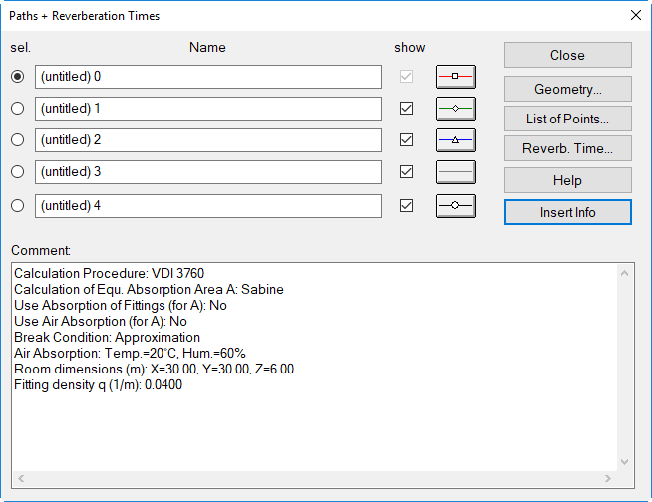
Configuration settings for curve „(untitled) 0“ inserted