Spatially averaged level spectra (Receivers)
With this function the diagram with the spatially averaged level spectra of all receivers (see Receiver) can be displayed. The evaluation is only performed for the current variant (see Variants):
Diagram Spatially averaged level spectra
By default, the diagram displays the spatially, arithmetically averaged level spectrum of all receivers including the NR and NC noise weighting curves determined according to VDI 2081-1.
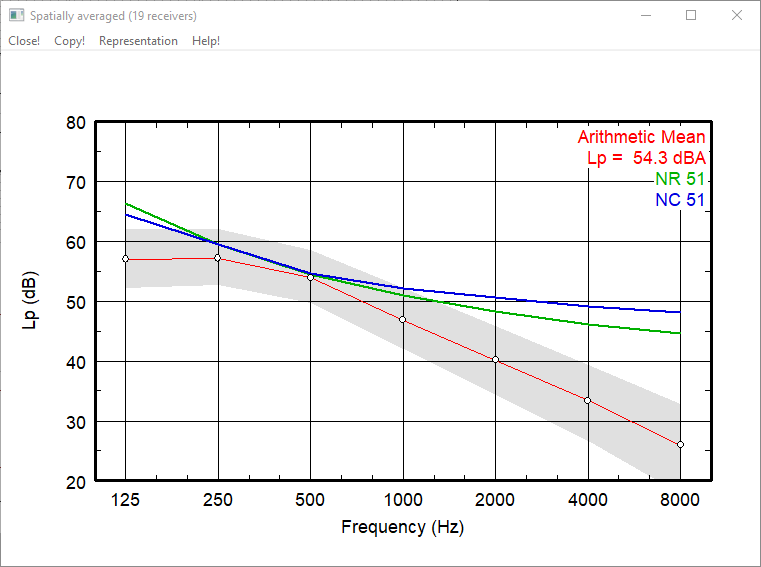
Arithmetically averaged level spectrum incl. determined NR and NC noise rating curves and display of the value range (gray)
NR and NC noise weighting curves
The NR and NC noise weighting curves as well as the evaluated single number values can be activated / deactivated via the Representation menu. For comparison, the noise weighting curves NC20 - NC80 and/or NR20 - NR80 can be displayed.
Evaluation type
The evaluation is done for all receivers per frequency band. The following options are available:
- arithmetic mean
- energetic mean
- maximum
Value range
With activation of option „value range“, the area in which all single level spectra lie is colored gray.
Show curves with A-weighting
At „spectral representation“, all curves can be displayed with/without A-weighting.