Path Geometry according to VDI 3760
In order to generate and calculate a path geometry according to VDI 3760, proceed as follows:
- Enter a receiver chain with at least two points.
- Open the Receiver Chain dialog.
- Select a point source via the selector symbol.
- Activate the option „SDC“.
- Click the „Create Path“ button.
Subsequently, CadnaR generates - after a prompt - a path geometry with distances between points in accordance with VDI 3760 (at a height of 1.5 m).
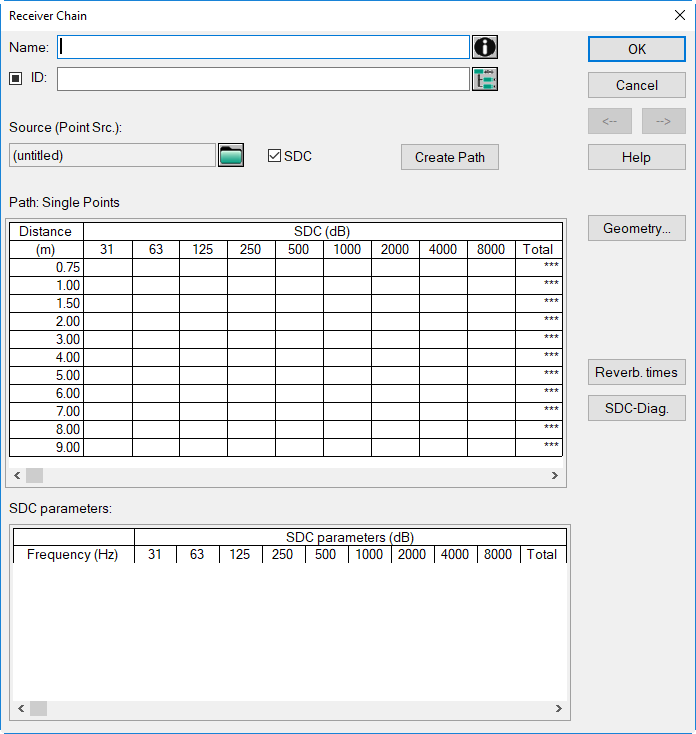
By closing the Receiver Chain dialog, the intermediate points are located on a straight line from the source to the last point entered.
Calculation
The calculation of receiver chain is performed via a separate calculation function, see Calculate Receiver Chains.
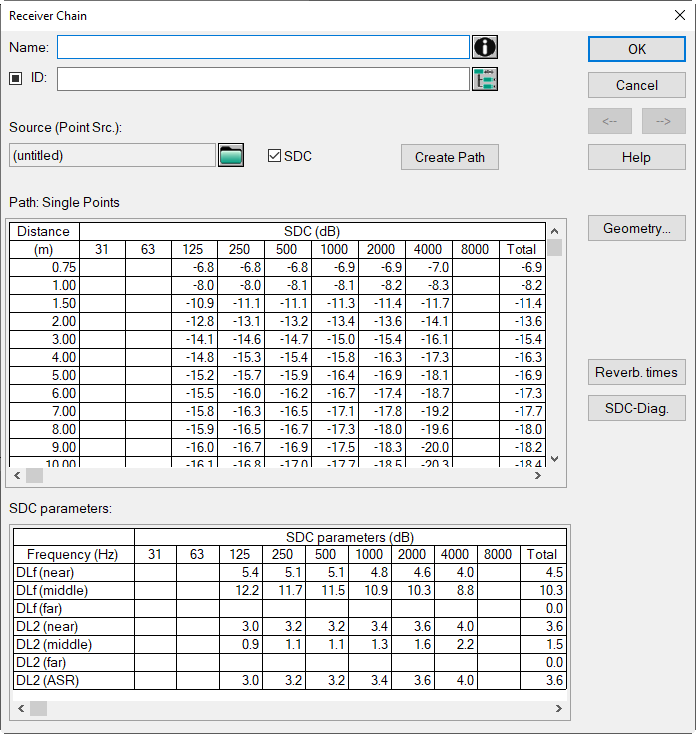
After finalization of the calculation, the levels of the sound decay curve at all distances and the SDC parameters - as available - for the distance ranges near, middle and far (see Diagrams (SDC/T), Editing the SDC diagram settings) are displayed:
- DLf level excess above free-field level in dB (see VDI 3760)
- DL2 level reduction per distance doubling in dB
- DL2 (ASR) level reduction in dB accord. to German noise prevention regulation ASR A3.7
To calculate the results for „Total“, the normalized A-weighted emission spectrum is used as the reference spectrum. This means that the reference spectrum selected on the „SDC“ tab (see „SDC“ tab) is not used, but the actual emission spectrum.
Dialog Geometry
Button Geometry: see Common Input Data - Geometry
For all subsequent diagrams, the respective diagram can be copied to the clipboard using the menu command Copy. Via the sub-menu Representaion|...| Variant Comparison, the resulting diagrams for the reverberation time and the sound decay curve (SDC) can be displayed for individual or for all variants.
- Reverberation Times: see User-defined Path Geometry, Dialog GeometryThe reverberation times of SDC receiver chains are averaged with all points of the chain (and not just with the measuring points with a distance between 2 m and 8 m according to VDI 2569).
- SDC-Diagram: shows the difference „sound pressure level SPL (LpA) - sound power level PWL (LwA)“ as a function of the distance from the sound source. The curves for the octaves and for total can be selected by turning the mouse wheel.The Representation menu can be used to display in addition:
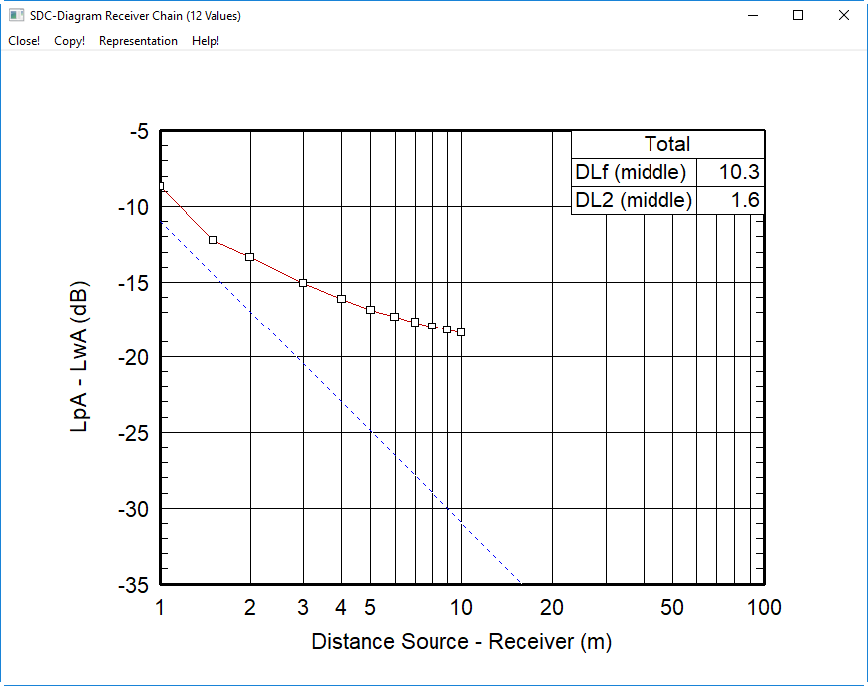
Via appearance menu, following information can be shown additionally:
- gradient SPL-PWL (Lp-Lw) for free-field propagation
- regression lines for the distance ranges near, middle and far
- SDC parameters Dlf, DL2 for the distance ranges near, middle, far and D2 (ASR)
Note
The SDC parameters are available as attributes (spectral and total, also with variant selection, see Object attributes).